
[Edit January 30, 2019:
After receiving some feedback about this post, I would like to address a few things that I think were not clear enough. I’d like to thank Scott Rao for his comments.
First, when I use language such as “over-extraction”, and “under-extraction”, I don’t mean that the associated extraction numbers are necessarily undesirable. What I really mean is “more extracted” and “less extracted” – the actual level of extraction that is desirable depends on several things, one of which is the subjective sensory factor. Another is the narrowness of the particle size distribution generated by a grinder, as I mentioned in the post. So, it would be wrong to say that an “optimal extraction is at 21%” for example; the exact number that someone finds optimal will depend on preference, roast development and quality, and evenness of extraction. The extraction yield numbers that I give in the text are just examples that I threw around, please don’t take them as absolutes.
It also came to my attention that the evidence for fast-extracting compounds being more on the “vegetal and sour” side of taste is speculative, so please take this claim with a big grain of salt. Instead, it would be more careful to say that low extraction yields will generally produce a less balanced overall taste, because only some fraction of all available chemical compounds get extracted. Think of it like listening to music with a very agressive equalizer turned on. The evidence seems to be stronger on the other side of average extraction yields, in the sense that bitterness and astringency are part of the slow-extracting compounds, and they tend to take a lot of space in the perceived taste profile of a cup.
I did not do a detailed consideration of the process of erosion in this post, but it still plays a role even in filter coffee. It is simpler to model because the fines just immediately extract completely in contact with water, so I did not include erosion in this discussion without some data to play with. The amount of fines present in a particle distribution will definitely have a strong effect on the flavor profile of the cup, on top of the size of particles – I will talk more about it in the near future !
Finally, please do take this whole model with a grain of salt – It was not yet tested against real data, I assumed spherical particles, and based all of it on the assumption that chemical compounds extract at a rate that decreases exponentially. My hope is that it will be useful to understand some aspects of extraction dynamics, but it is in no way a perfect model.
]
Coffee extraction is a subject I’ve touched a few times on this blog. Today I want to have a more profound discussion on this subject, because I recently realized I had a very simplified view of what’s happening during coffee extraction. I’ll go over the basic principles first, and then gradually deeper and deeper in this rabbit hole. This is one of those times where I will be posting some equations, but I will try to translate them in words and figures as we go along, so please don’t feel bad if you don’t know anything about maths. I hope to be able to describe them well enough that you won’t need to have a degree in maths or physics to follow the big picture. The value of equations is that they allow me to see what arises from just a few fundamental suppositions.
Specialty coffee brewers often talk about total dissolved solids (TDS) and average extraction yield (EY) when they describe a method or a coffee they brewed. As I briefly described earlier on this blog, the first concept of TDS really describes the concentration of your beverage: espresso typically has 7% to 12% TDS, and filter coffee typically has 1.3% to 1.45% TDS. The second concept of average extraction yield describes what fraction of the coffee beans were dissolved in your beverage. This number is typically between 19 and 23%, and can never go above ~ 30% because the remaining 70% of the coffee beans is just not dissolvable in water.
At first glance, knowing the average extraction yield might seem to be just another, more convoluted way of describing the concentration of your coffee. But it’s not ! Average extraction yield was found to correlate very well with the taste profile of a brew. If you make three brews with the same coffee, and reach 18%, 22% and 27% average extraction yields, then add the appropriate amount of water such that they all have the same concentration (e.g. 1.3% TDS), the three cups will taste very different. The first one will tend to be more vegetal and sour, the second one will be more well-balanced, complex and enjoyable, and the third one will be more bitter and astringent.
Why does average extraction yield correlate so well with flavor profile ? Ultimately, this is due to different chemical compounds extracting at different rates. Some of the compounds that we typically don’t like to taste are very slow to extract (thankfully !), so they will start to become apparent only when you reach high extraction yields. Other components that extract very fast are enjoyable, but if they’re not balanced with other stuff they produce a less interesting cup. In other words, our goal is to extract as much of the good stuff (the compounds that extract at average and fast speeds) as we can, while avoiding the nasty stuff (the compounds that extract at slow speeds).
The concept of an average extraction yield is useful, but it’s not at all the ultimate descriptor of a coffee cup’s flavor profile. Imagine a situation where some of your coffee grounds extract faster than others – the resulting coffee cup might be composed of some grounds extracted at 18%, and others extracted at 28%, and you could still get an average extraction yield around 23% in the cup. If you were to compare this with a cup where all coffee grounds extracted at 23% exactly, you would most likely find the second cup more enjoyable (this is not the one they sell at Second Cup). Basically, the second cup has extracted a lot of the “good stuff”, and very little of the bitter, astringent taste. The first cup however has a lot of coffee grounds that reached a 28% extraction yield, so they will be contributing some of the less desirable taste in the cup.
One practical result that arises from this is that lower quality equipment or brew methods that produce a wider range of extraction yields will only allow you to reach average extraction yields around 20-21%. If you go any higher than this, then you will start getting too much of the bitter taste. If you manage to produce a brew where the extraction of individual coffee particles is much more uniform, then you will be able to reach higher average extraction yields, about 22-24%, without getting too much of the bad stuff.

One thing that can explain why your coffee particles may not all extract at the same rate is the fact that they may have different sizes. As Scott Rao explains nicely in this blog post, there are two completely different physical processes by which coffee extracts: erosion and diffusion. Erosion happens when a coffee cell is broken and water can very easily wash away all of the dissolvable compounds that it contains. As coffee cells are very small (around 20 microns), this happens only at the surface of coffee particles, where some broken cells are exposed, or in coffee particles so small that all coffee cells are broken up. In this scenario, water dissolved the full ~30% of anything that can be dissolved very fast. As you may have guessed, erosion is the dominant process in espresso or Turkish brews, because those use very fine grind sizes.
Diffusion is the process that dominates in filter brews. In this scenario, water has to enter the tiny pores of the coffee cell walls, dissolve the flavors, and come back through the tunnels. As you might expect, diffusion is much slower than erosion. In this post I will focus more on diffusion, because filters brews are my bigger focus at the moment.
Now comes the part I did not understand very well until very recently. One thing I mentioned earlier on this blog was that smaller coffee particles extract faster than the larger particles. This was actually kind of true, but my reasoning was not. I was really confusing the extraction of a single coffee particle with that of a population of coffee particles. If you have a collection of very coarse coffee particles, they will collectively extract much slower than a collection of very fine coffee particles, because the finer particles are presenting much more total surface for the same total mass of coffee.
If you look at a single coarse particle and a single fine particle however, and measure how fast they provide flavor compounds, then the picture is quite different. The single fine particle is much lighter, and has a much smaller total surface than the single coarse particle, so it is actually the coarse particle that would win the race to higher concentrations. Assuming the fine particle is large enough that we are still within the regime of diffusion, each cell at the surface of the fine coffee particle is extracting at the exact same speed as each cell at the surface of the coarse particle.
The last paragraph is really key to understanding why I have been thinking a lot about this lately. It’s worth reading it again and make sure you understand it well. Once you do, something might become clear to you: a population of finer grinds will reach higher beverage concentrations faster, because you have a large number particles and they collective provide coffee compounds faster than a collective of coarse particles, because of their larger total surface area. Our picture of how TDS depends on grind size is quite clear.
BUT, once you accept that each coffee cell at the surface of each coffee particle extracts the same way and at the same speed regardless of the particle size, then it becomes entirely mysterious why different grind sizes or different particle distributions would produce different uniformities of extraction yield, and different taste profiles ! If this was the whole picture, then the only thing we would ever care about would be the beverage concentration (in % TDS), and all coffee cells would always be providing us with the same flavor profiles whether they are attached to a large or a small coffee particle.
I think the key to understand the link between the distribution of particle size and the distribution of extraction yield is something else: deeper layers of coffee cells extract slower than surface layers. Imagine you had only two layers of coffee cells that can be reached by water, and the deeper layer extracts much slower than the surface layer. Now imagine you have two spherical coffee particles, one that is just as large as two layers of coffee cells, and one that contains thousands of layers of cells. Let’s draw this:

It might become obvious from this drawing that the amount of second-layer cells is much smaller than the amount of surface cells in the small coffee particle. In the case of the very large particle, they’re almost equal ! This immediately provides a way to understand how different-sized coffee particles are providing different flavor profiles. The small particle will be producing a more uniform extraction yield, because it is composed of one surface layer extracting uniformly, plus a small contribution of a deeper layer that extracts slowly. The combination will be a little bit non-uniform. It will be skewed slightly on the low extraction side, because of the small contribution of these second-layer coffee cells. The larger coffee particle will produce a much less uniform extraction, because the contribution from the slowly extracting second-layer cells is as big as that of the surface cells. Once again, I think this might be easier to understand with a figure:

In real life, water is able to reach a bit deeper than two layers of coffee cells. In one of my earlier posts, I discussed a recent experiment carried out by Barista Hustle, which demonstrated that water can reach down to approximately the 5th layer of coffee cells on average. If you haven’t watched their video, it’s worth it – this is what made me realize that I was misunderstanding the details of extraction.
So now, we saw that each size of coffee particle produces a distinct profile of extraction yield, and therefore a distinct flavor profile. We also saw that coarser particles inevitably produce less uniform extractions. You can now see why using a grinder that produces a very wide distribution of coffee grind sizes might be a problem: you are mixing up lots of different flavor profiles. However, this new way of thinking about extraction might also have you realize that a perfectly uniform particle distribution will not produce a perfectly uniform distribution of extraction yield !
Instead, such a perfectly uniform particle distribution would just produce exactly the same extraction yield distribution than a single coffee particle would – and it is not uniform. Still, the final extraction yield distribution will be tighter if your particle size distribution is also tighter, which is desirable. It still came as a shock to me that even with a light years-wide roller mill grinder, you will not obtain a perfectly uniform distribution of extraction yields, unless you also use coffee particles that all contain exactly 2 x 2 x 2 intact coffee cells (OK, maybe you can do this if you have such a large grinder).
There’s also another consideration about grind size which I did not touch in this discussion: coffee waste. The coarser you grind, the larger will be the total mass of coffee that is inaccessible to water. This means that, in addition to changing the taste profile, grinding coarser is in some way similar to also using a smaller coffee dose. I won’t discuss this more in this post, but it’s worth remembering it.
Now let’s do some maths
Now that I’ve tried to lay out the concepts with hand waving explanations and drawings, I’d like to attempt formalizing it with equations. Those not too versed or interested in maths may find the rest of this post anywhere between boring to insufferable. I find it really interesting to be able to write down equations to describe a system and see where it leads me. Often, this is a way to realize some consequences that you may not have foreseen, and I think some of you will find value in the figures below (or even in the equations).
The first assumption I will base this formalism on is that each of the chemical compounds in a coffee cell gets extracted at an exponentially decreasing rate:

In this equation, m_i is the amount of mass extracted from a chemical compound that we would call “compound number i“, t is the amount of time since the beginning of the extraction, and τ_i is the characteristic time needed to extract the compound: it’s larger for the more slowly extracting compounds. The left-side of the equation is a time derivative, which means that it describes the rate of mass extraction per unit of time. This might seem like I pulled this equation out of nowhere, but it’s something that arises quite often in these kinds of problems: there is initially a lot of different ways for water to enter in contact with large amounts of the solvable compound, and the least of it remains in the coffee cell, the slower the extraction rate becomes. I’m not convinced this is the ultimate way to characterize this problem, but I think it’s at least a good one.
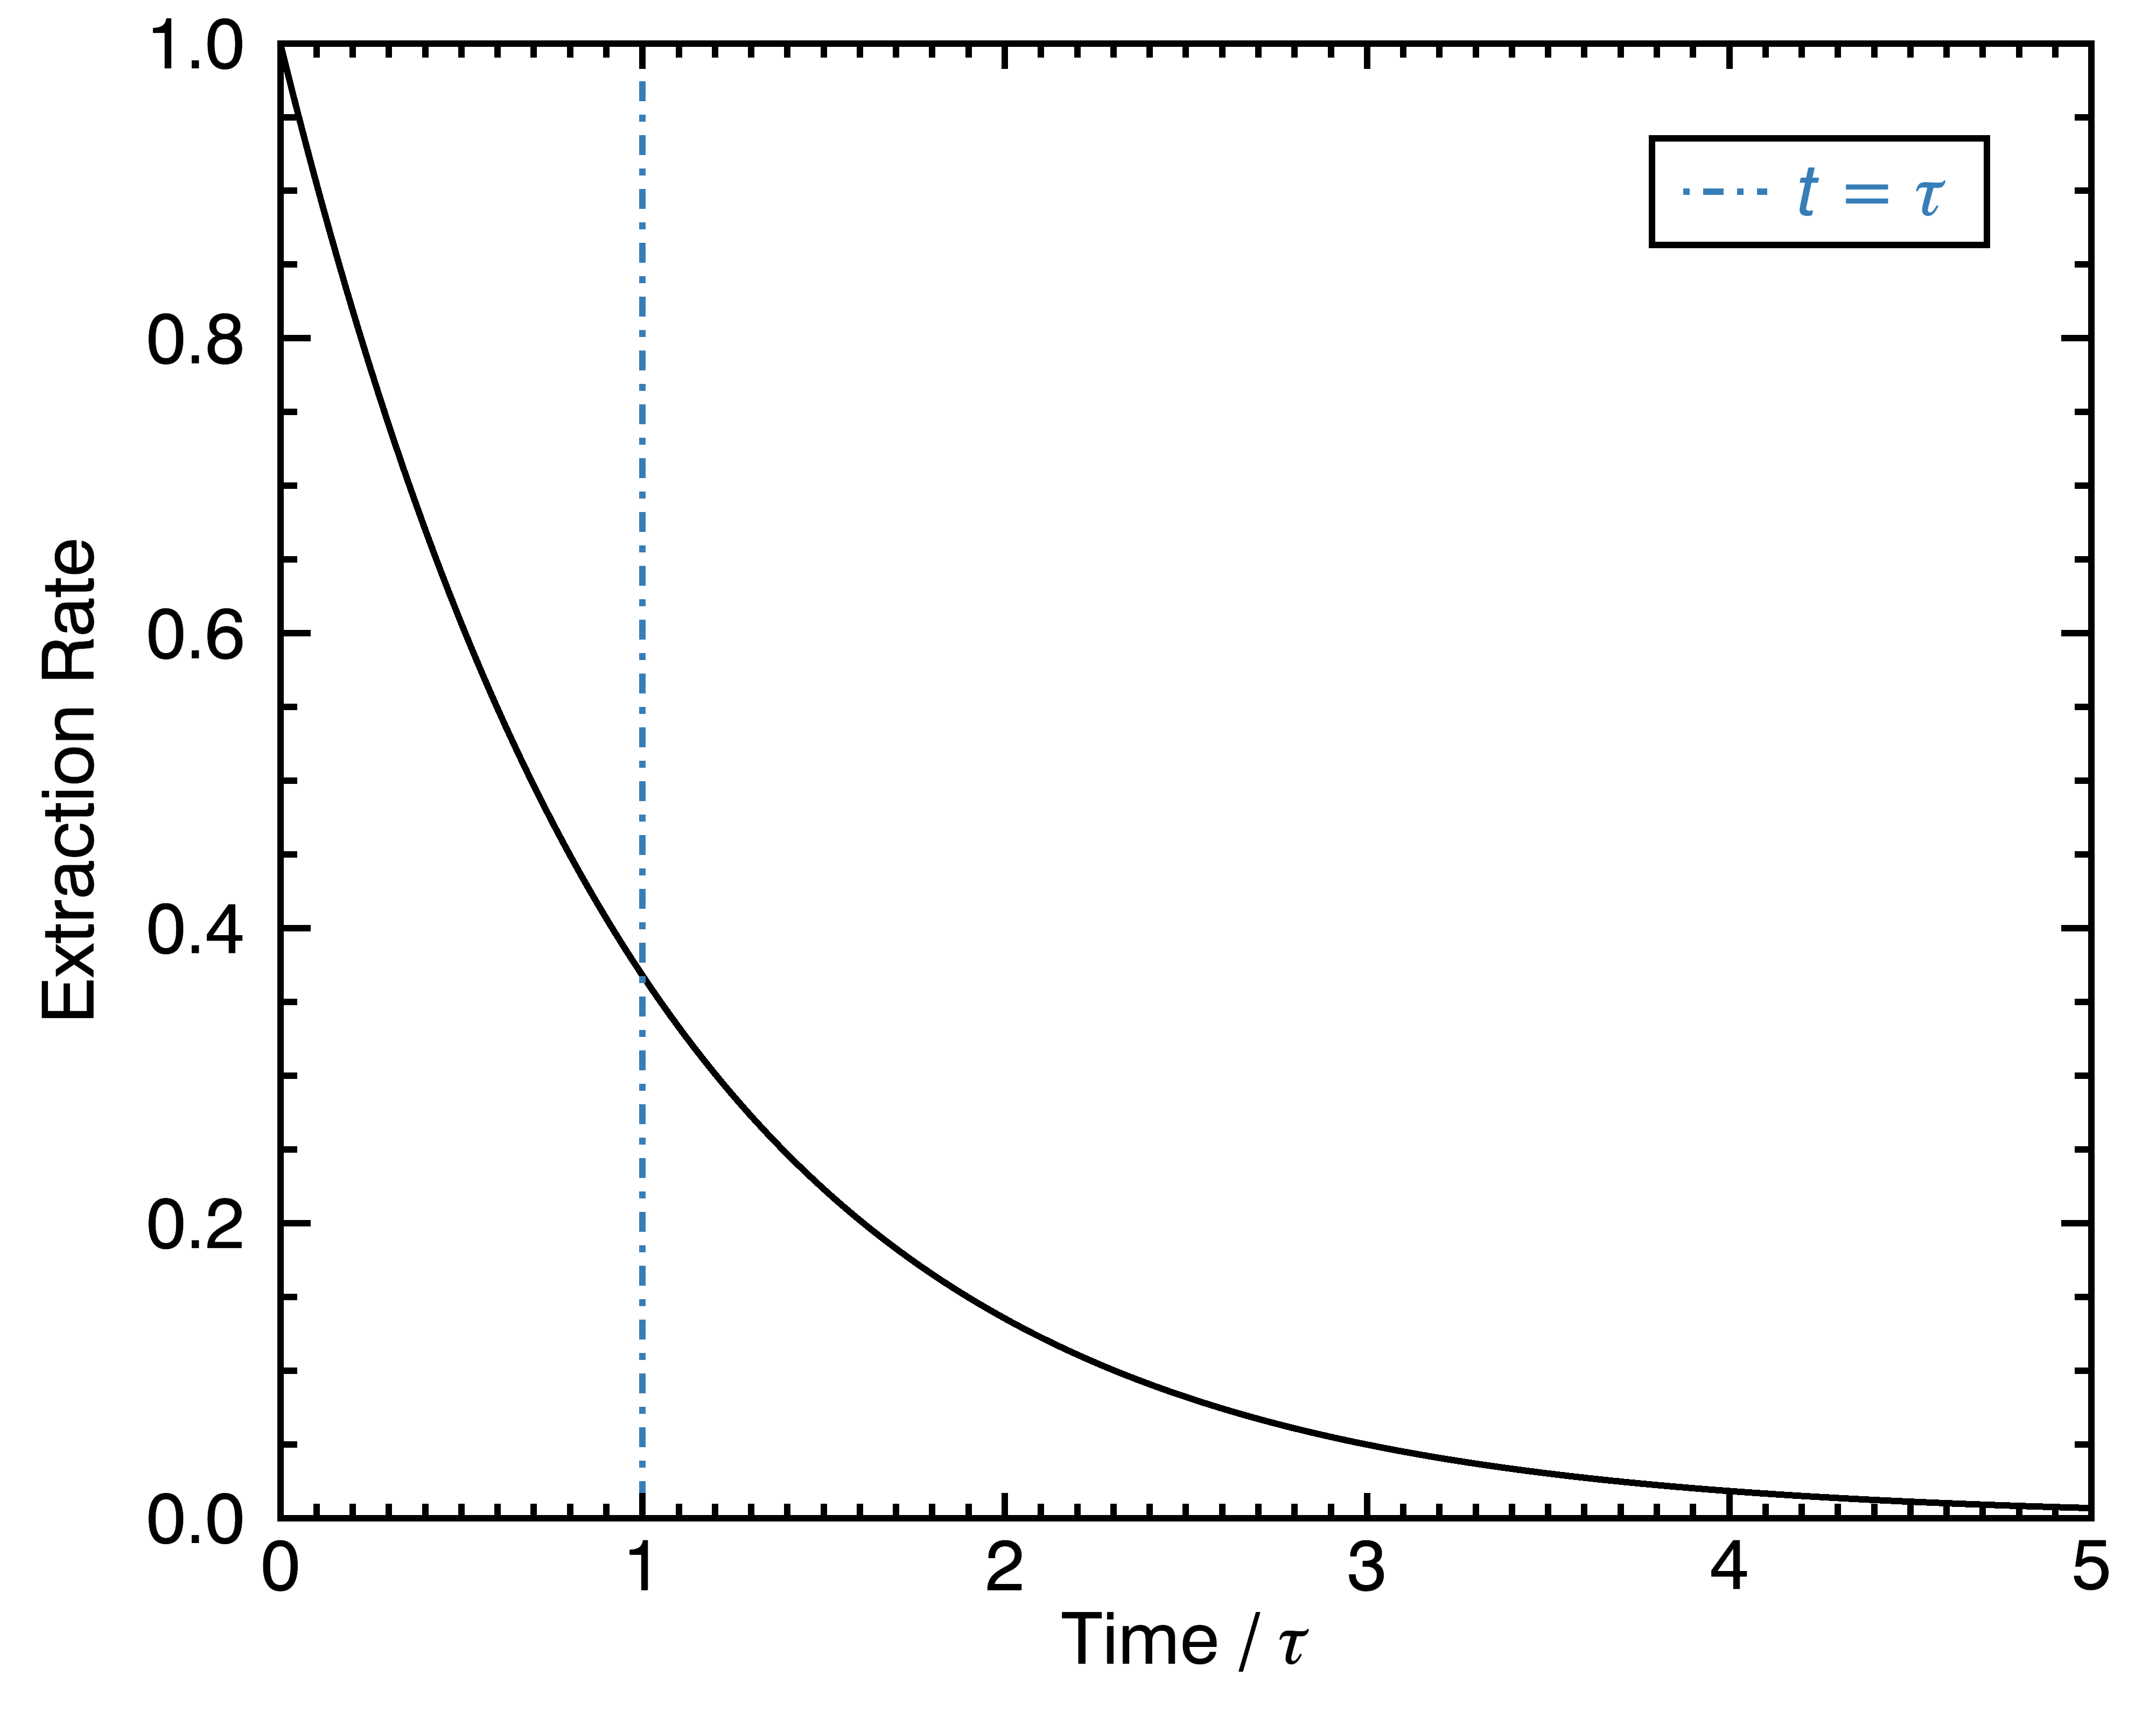
This equation tells us about the rate of increase of the compound, but what we really want to know is the amount of extract that ends up dissolved in water as a function of time. To obtain this, we need to solve the equation above (which I won’t do in detail here). The solution is:

where a new constant M_i was introduced, representing the total mass of this particular compound inside the coffee cell. At this point, it would be worth visualizing what this equation looks like:

Now, given that each chemical compound extracts at its own speed, obtaining the total mass of everything extracted requires you to take the sum of the equation above, for all available compounds:

Now, what does the sum of lots of different extraction equations like those look like ? It’s really hard to tell if you make no assumption at all about the collective properties of the extraction rates τ_i. One way to go around that is to do it numerically, or something else we can do is ask what the result looks like if all the extraction rates τ_i are close to one another, and thus close to an average extraction rate τ. A mathematical way to express this is:

Here, τ is the average characteristic extraction time, and ε_i is just a symbol I decided to use to express the small deviations around the average, for each compound. It may seem weird that I defined this equation with respect to the inverse of the extraction times, but it will make the subsequent maths easier. Now, I need to make the approximation that the deviations are very small with respect to the average:

And this will allow me to simplify the equation for the total extracted mass as a function of time, with a neat trick that physicists love, called a Taylor expansion around ε_i = 0:


The technical term for what I just did there, besides annoying most of my readers, is a first-order approximation (literally, not just figuratively). You might notice that the first term on the right part of the equation is very similar to the equation we had for a single species, with τ_i replaced by the average τ. This is very neat, because it tells us that this very similar equation is a zeroth-order approximation of the real solution. This means that it captures the largest portion of the answer, as long as the ε_i factors are small like we first assumed.
The second term, which looks a bit more complex and still has this big Σ symbol that represents the sum of many terms (i.e., all the chemical compounds), is a first-order perturbation. If you add it, your answer will be more precise. There is an infinite number of smaller and smaller terms that you could add, which would make your answer more and more precise. If you added this infinity of terms, the solution would be valid regardless of whether all the ε_i are small or not. It turns out that the zeroth-order approximation is quite good (to 1% precision) if you have a lot of chemical compounds (at least 100) even if some extract ~15% faster or slower than the average:

Now that we have described more formally what happens to a single layer of cells, we can turn our attention to the more general case where there are more than one layers. Without any detailed experiment, we need to make an assumption about the rate at which water is able to access the deeper layers. Intuitively, I see water diffusing in the coffee particle like an ensemble of small creatures that walk around randomly, and have a very small chance of getting through a door which leads to a deeper level of cells, or one that leads to a shallower level. In order for water to grab some compounds from the deeper layers and bring them back out, it will need to be able to pass back and forth through several doors.
What this kind of scenario tends to produce is also an exponentially decreasing access to the deep layers (by this point, do you think I love exponentials ?). To be sure about that, I decided to actually run such a simulation, where I took a million “droplets” of water that have a 0.1% probability of crosser over to a deeper or shallower layer at every step of time. I ran the simulation for ten thousand time steps, and every time a droplet came out of the coffee particle, I asked it how deep it reached. I then made a figure with the distribution of depths that each droplet reached:

In other words, the deeper layers will extract exponentially slower. If we decide to call s the coordinate that points inward to the deeper layers, then the characteristic time of extraction τ_i will be the combination of an intrinsic rate τ’_i dependent on chemistry, and the depth x:

The new parameter λ represents a characteristic depth before which most of the extraction happens. If it’s small, then the extraction will only happen in a very thin shell of the coffee particle, and if it’s very large, some extraction may happen deep into its core. In reality, thanks to Barista Hustle we know that this parameter λ is probably of the order of 100 microns.
This new level of complexity means that we need to sum the extraction equations over all depths, each having their own extraction speed. The result is:

In that equation, R is the radius of a spherical coffee particle and s is the typical length of a coffee cell (about 20 microns, we assumed the cells are cubes). The index k is representative of the layer, where k = 0 is the surface. There’s a term in (R – k s) squared that appeared, which is due to the geometry of a spherical particle; each level deeper has a smaller amount of cells in it. For non-spherical particles, this term would be a bit less steep. The spherical case scenario is the most dramatic one, in the sense that the deep layers are slowest to extract (this is because spheres have maximal curvature).
There is a way to make the equation above a bit more easier to deal with, by assuming that the cell layers are continuous instead of discrete. This is not true in real life because there are no “half-cells”, or fractions of cells, extracting in their own particular ways. However, I believe a continuous model would be more realistic because it would be more similar to the results of irregular layers of cells, where not all cells in a given layer are exactly at the same depth, or have exactly the same number of entry ports. These small random deviations in the exact extraction speed within a given layer of cells will produce a similar effect to the assumption of continuous layers of cells. Thus, here is the continuous version of the equation above:

In this equation, x represents the depth inside the coffee particle (expressed in the same units as the radius R). One may be tempted to solve this integral and find a form for the extracted mass versus time that is easier to work with, but don’t go there – you would encounter a dreadful beast that has many names, one of which is the confluent hypergeometric function. It takes three sets of arguments, and is a real nightmare to deal with (to all readers that are thinking right now “what the hell is this guy rambling about“, I apologize).
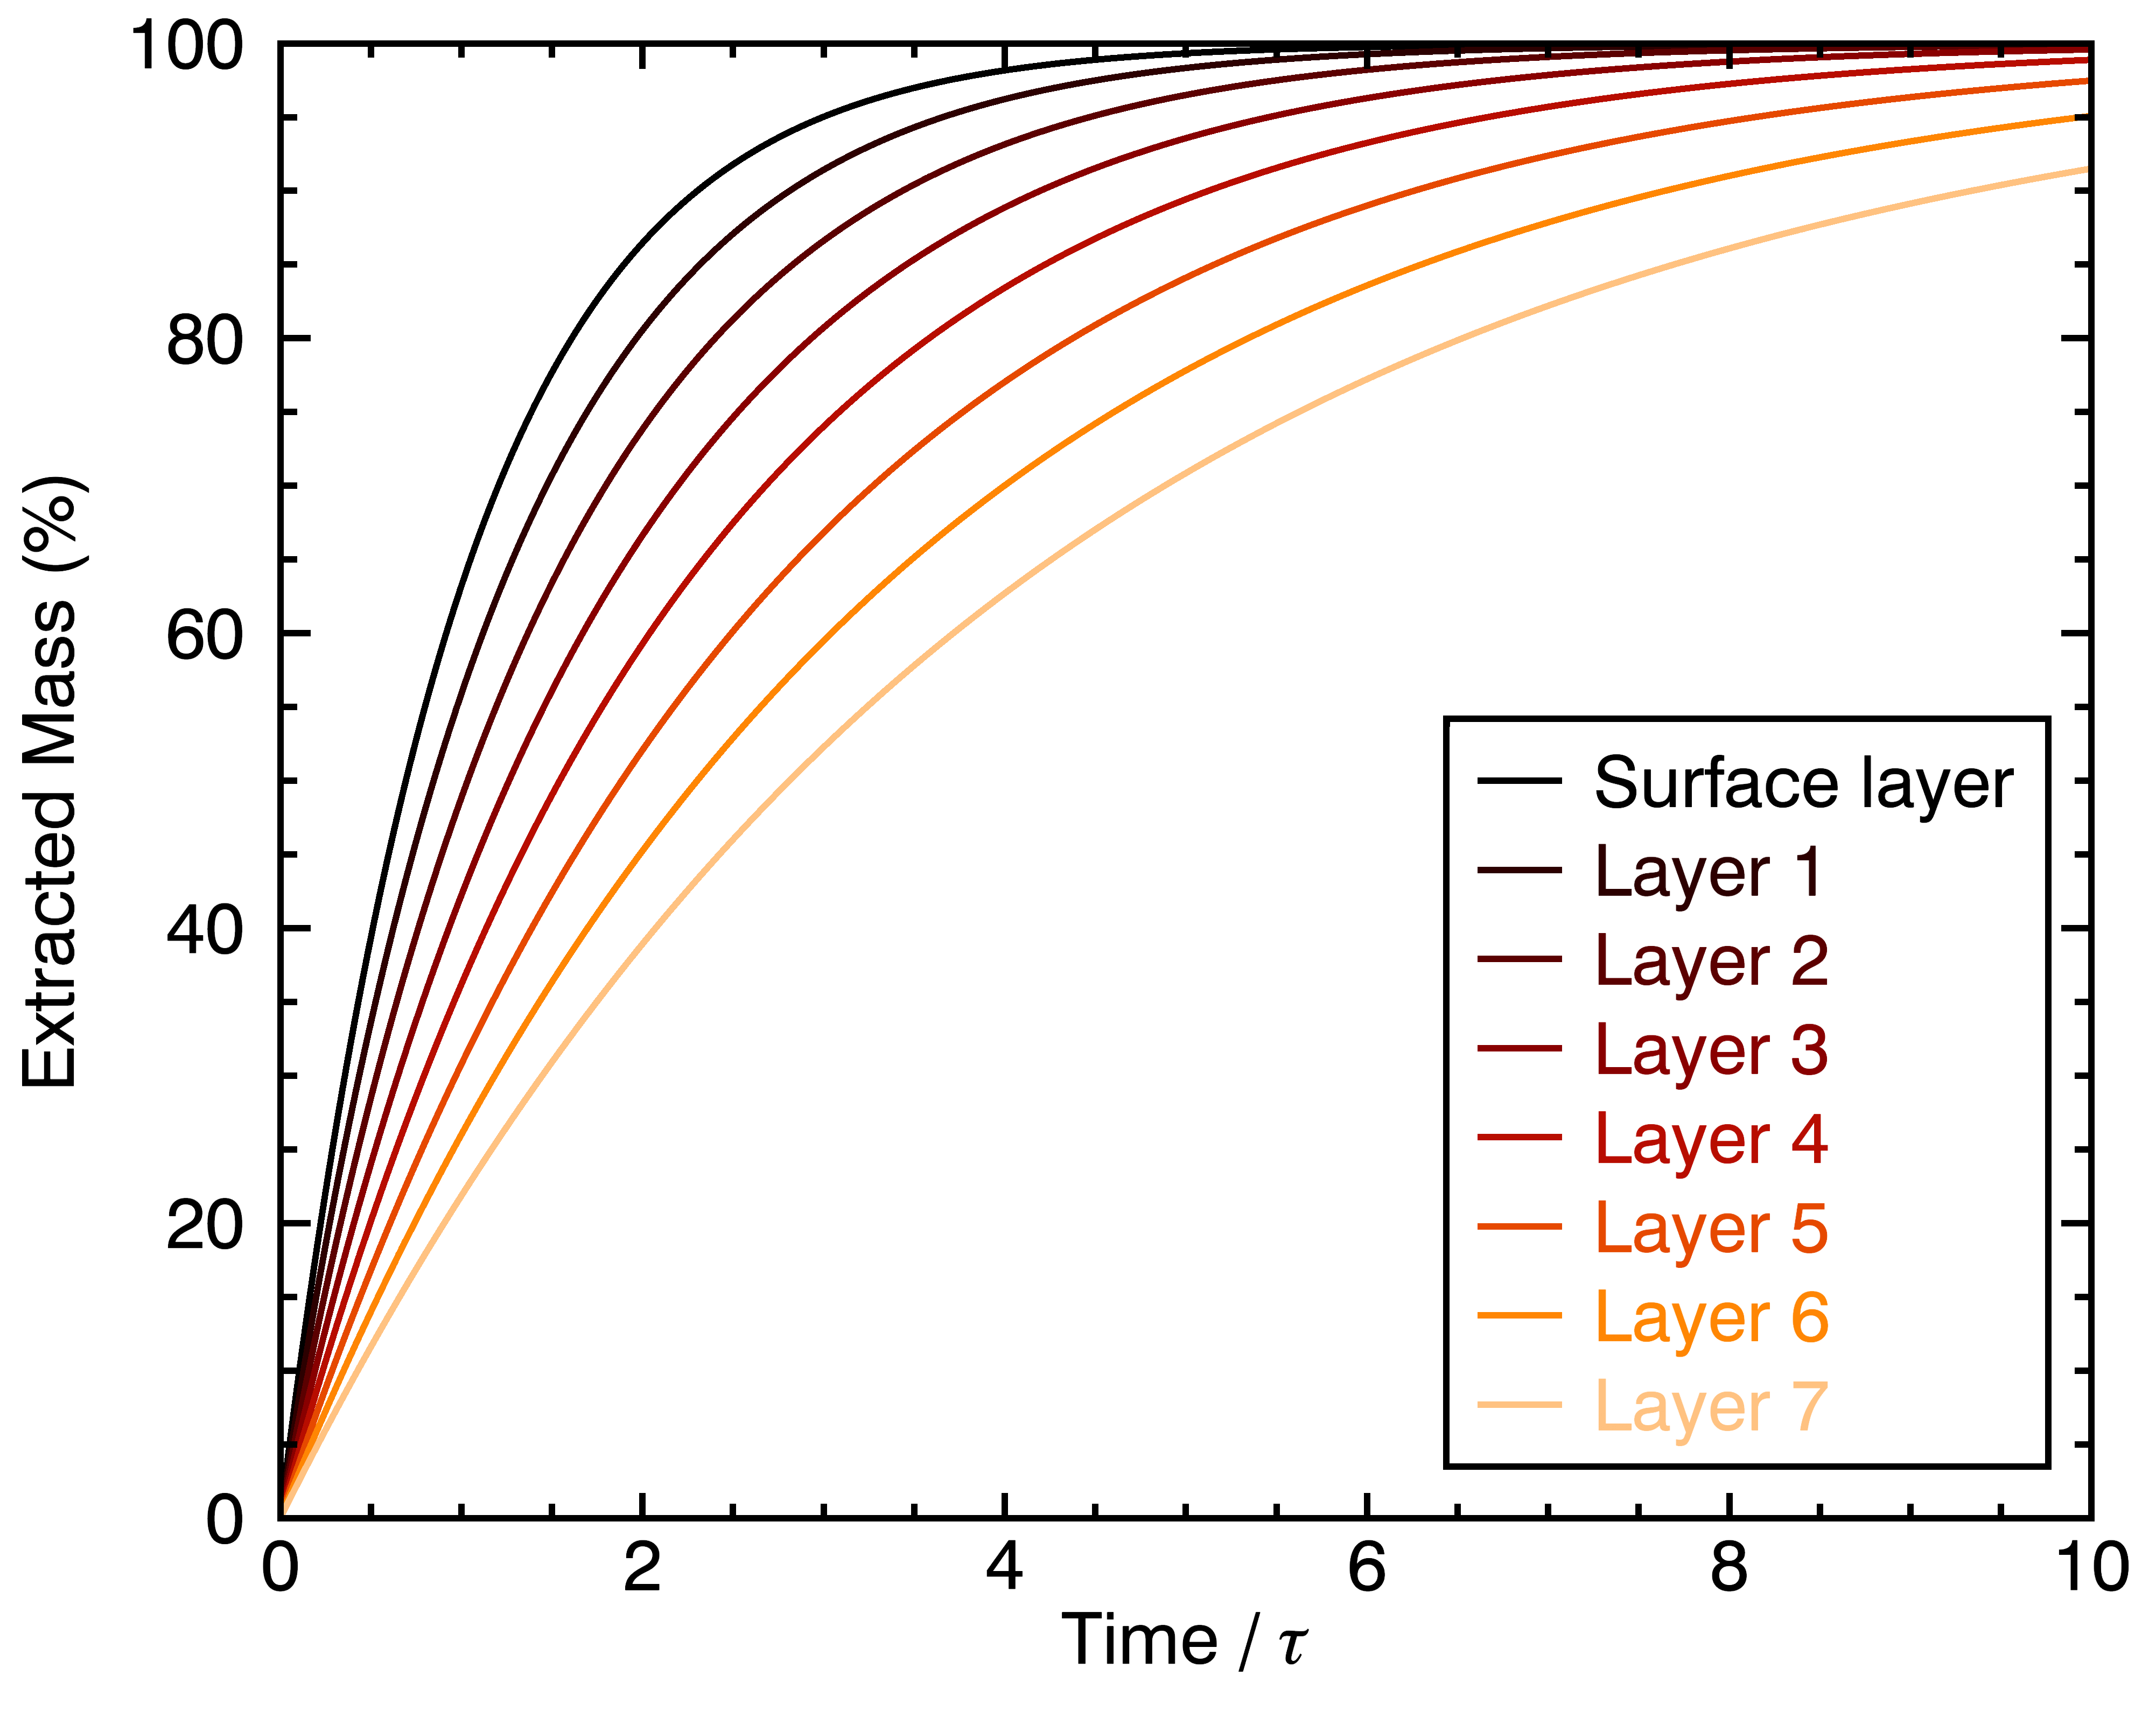
Now that we re-framed m_i in this way, it now represents the full extraction output of chemical compound number i for a full coffee particle, instead of just a coffee cell. Let’s see how its rate of extraction would be affected by the fact deep layers extract slower:

Basically, the overall extraction for the spherical coarse particle is slower, and reaches an inflection point where this become really slow near 3 times the characteristic extraction time τ. If you’re willing to, go re-watch the Barista Hustle experiment, you might notice this red curve looks a lot like the cupping bowl that contains coarse coffee grounds !
Now, another interesting aspect is to estimate the contributing fraction of a fast-extracting compound to the beverage, as a function of time. Obviously, the concentration of this compound will be at its highest when the brew just started, because it had a head-start from being a fast-extracting compound. Here’s what this would look like:

… and if we did the same thing for a slow-extracting compound:
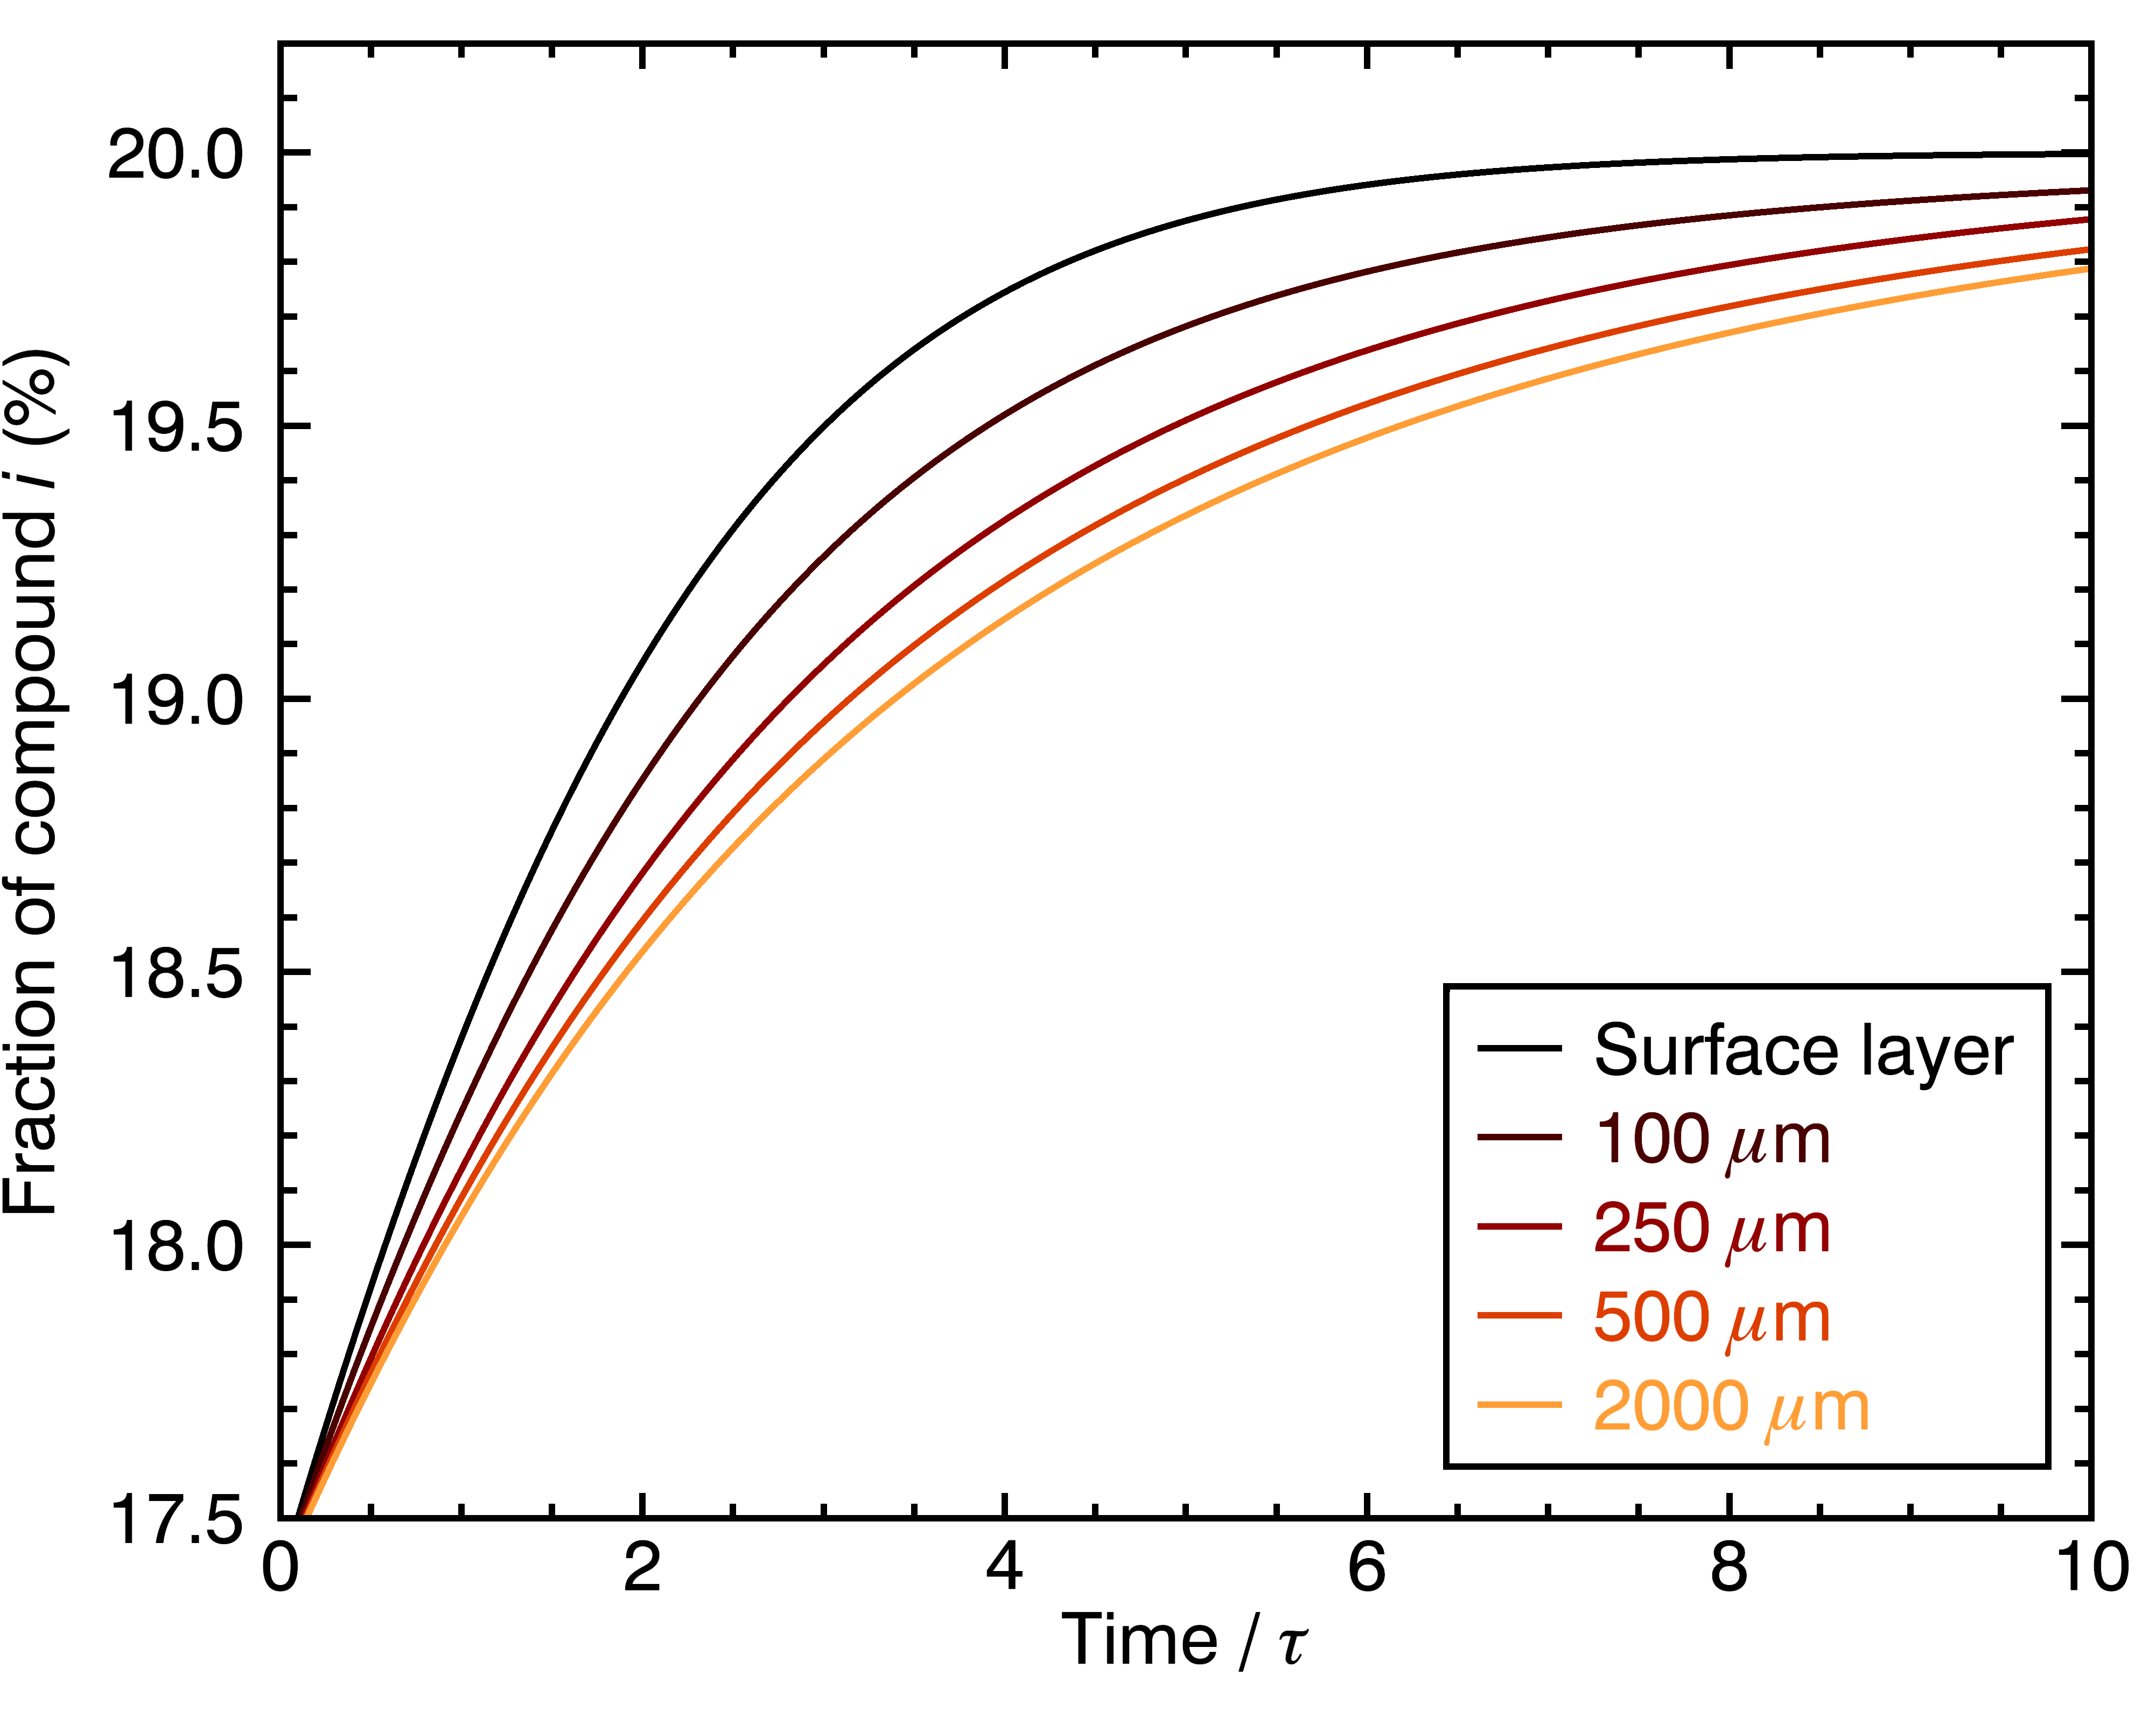
The figures above show how even this contribution of a given chemical compound to the cup’s flavor evolve differently for particles of different sizes. One way to go even deeper is to look at the distribution of extraction yields per coffee cell, in terms of their contribution to the total beverage by weight. Let’s look at the result for four different particle sizes, and three different brew times:

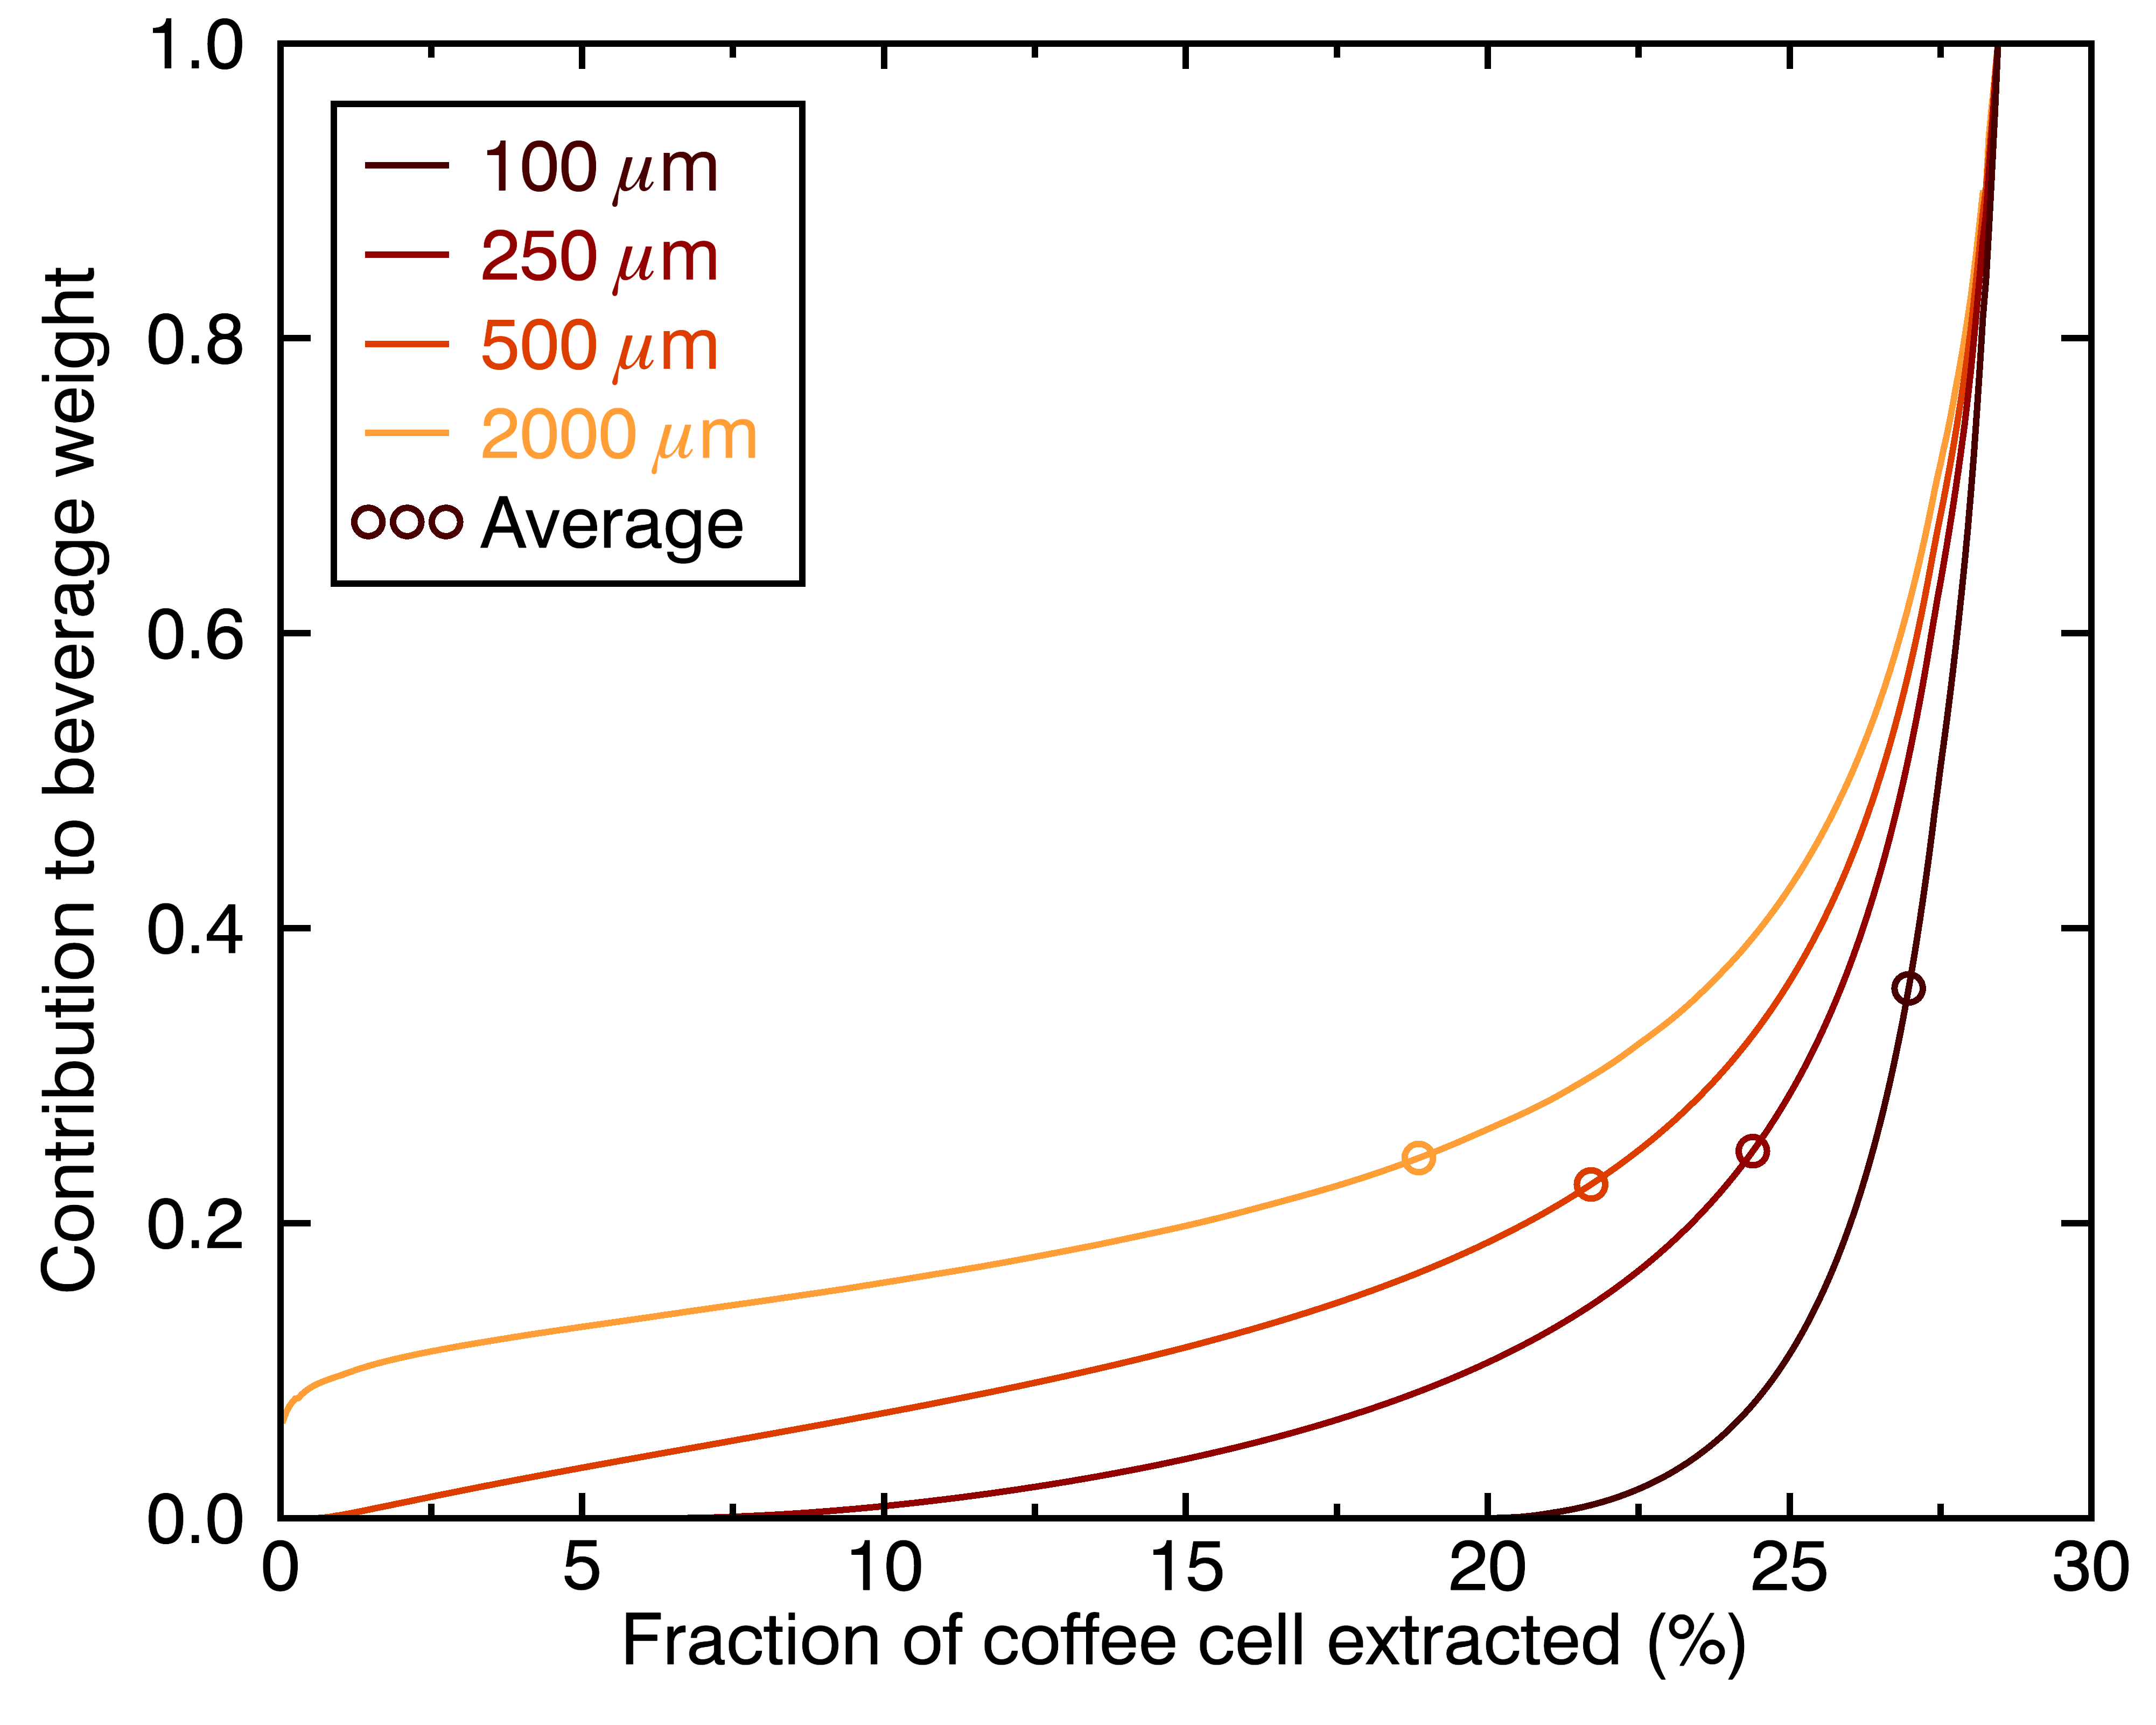
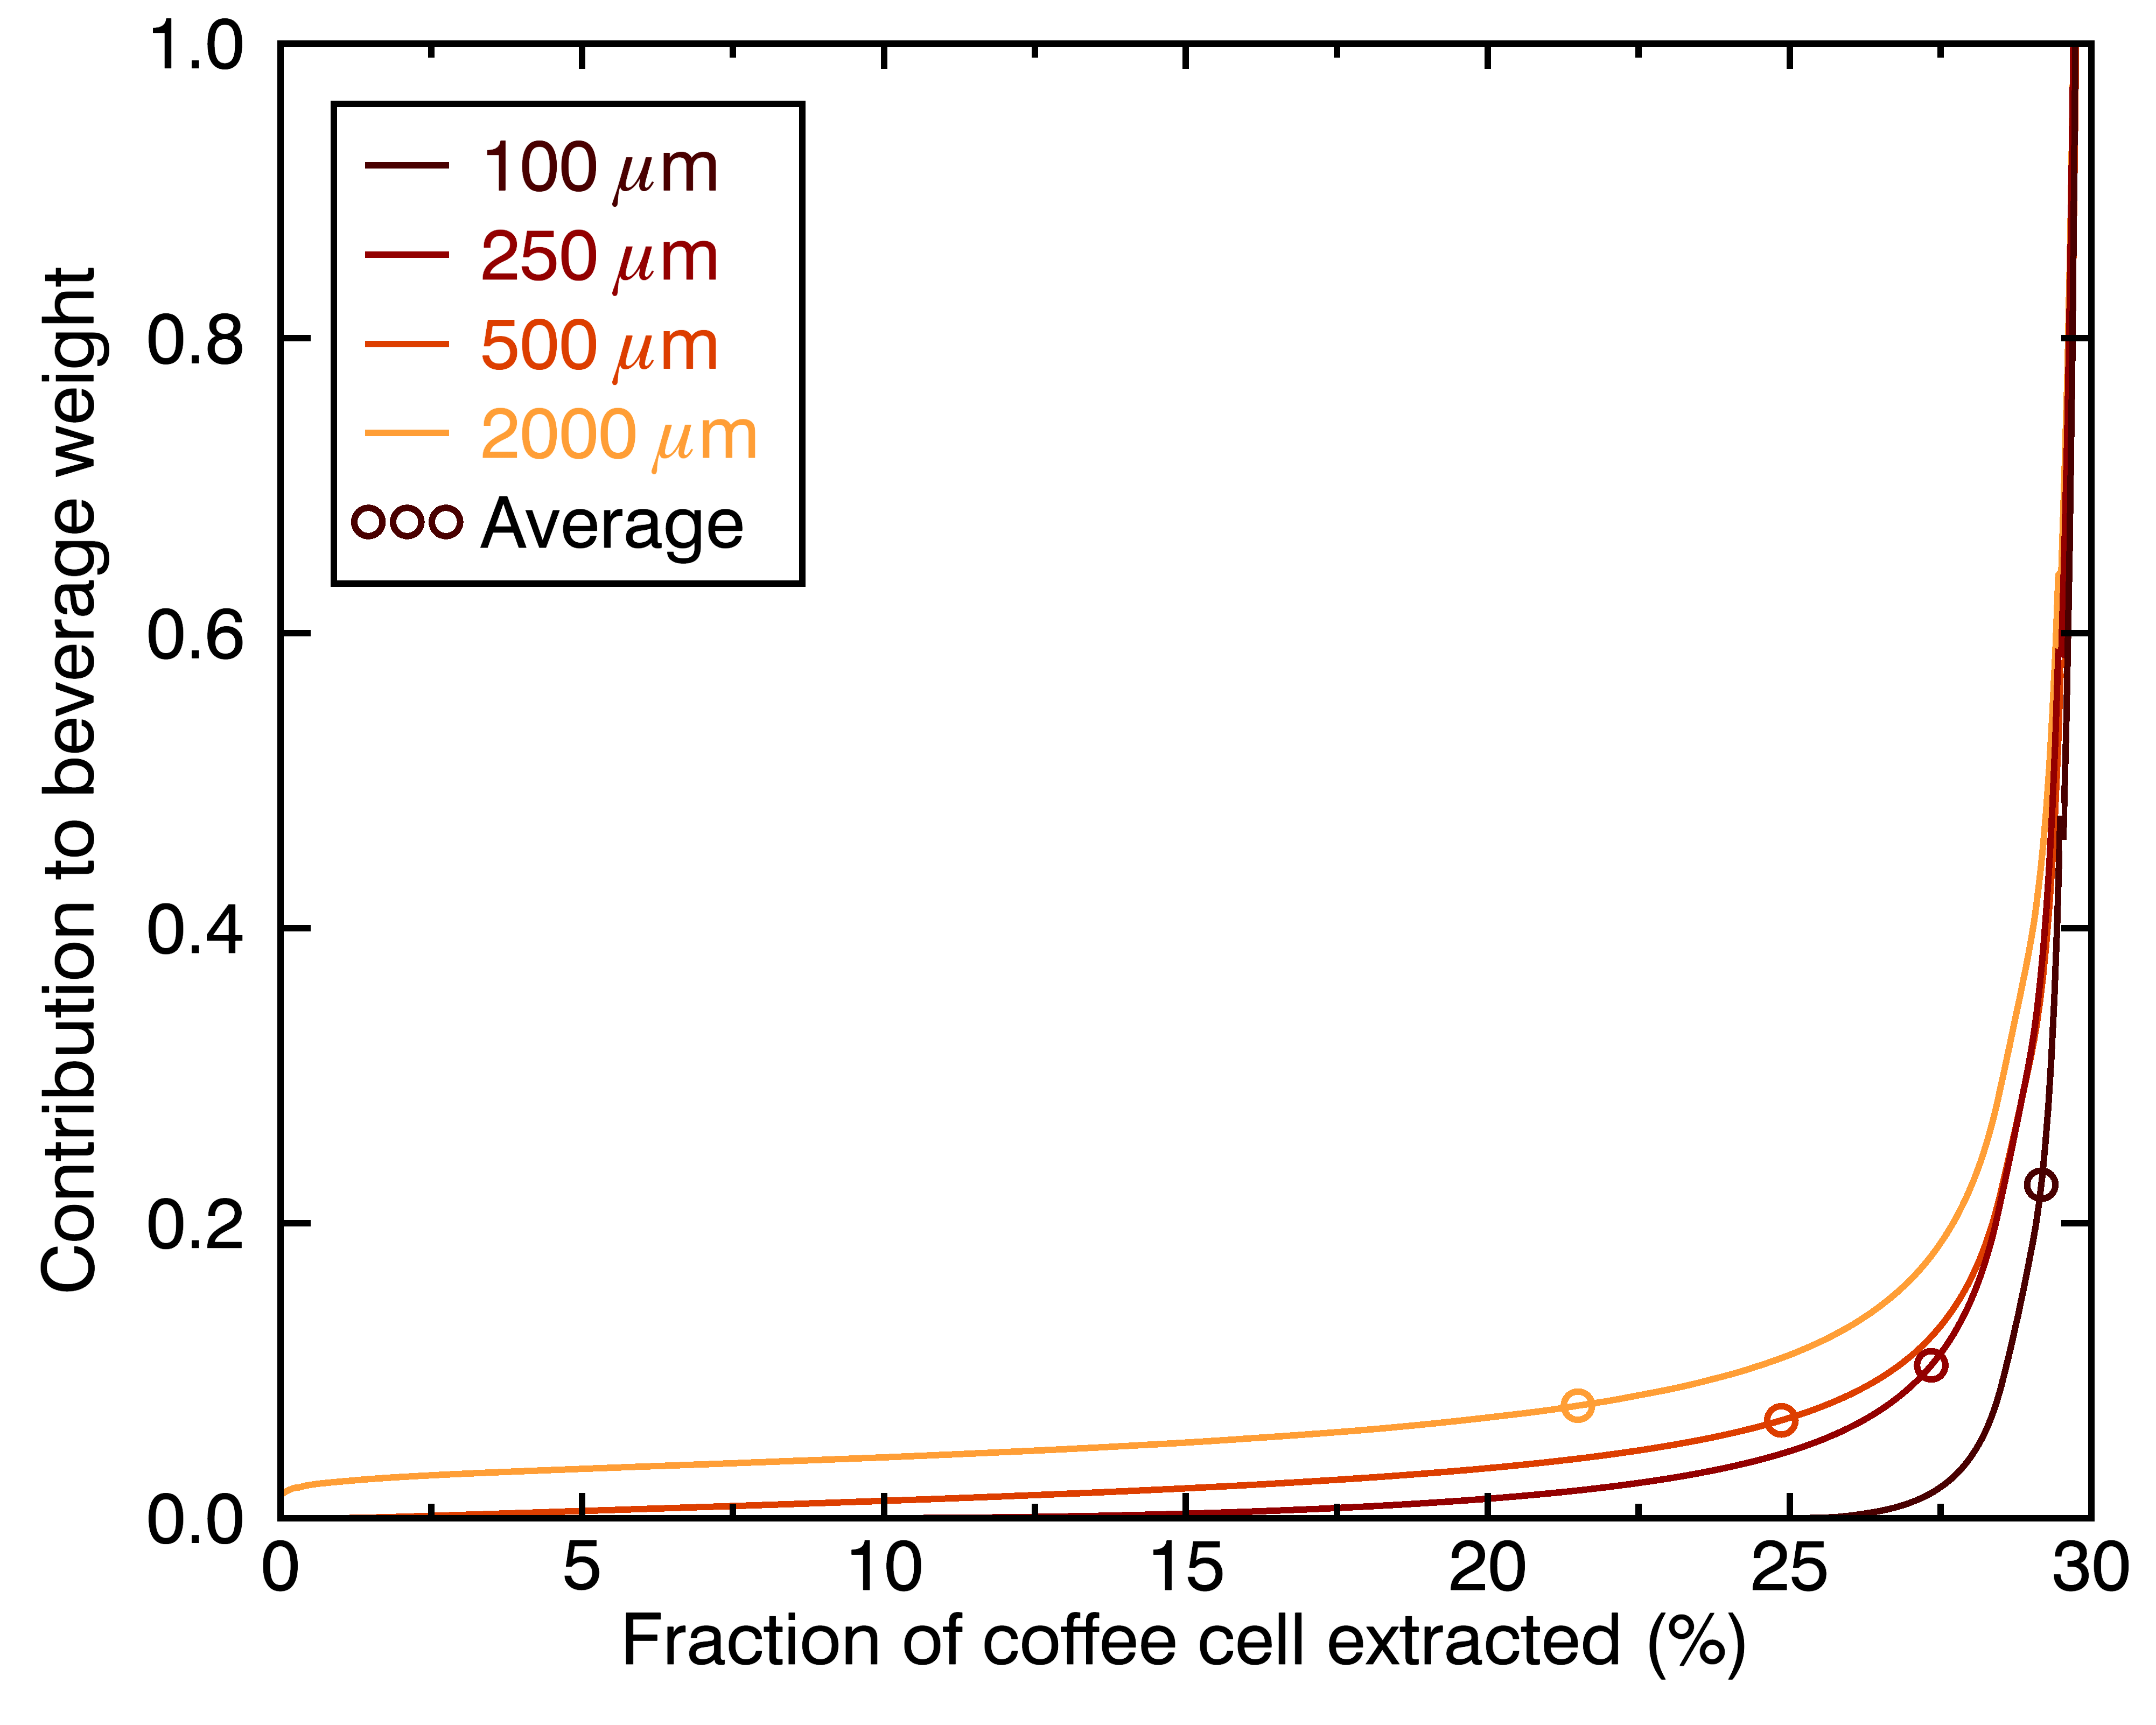
There are a few things we can learn from these figures:
- Different-sized coffee particles provide different flavor profiles to the cup.
- The highest extraction yields are always the top contribution, regardless of particle size (they correspond to the collective outermost layer of all particles).
- A coffee cup made with a perfectly even distribution of particle sizes will not taste like a set of perfectly evenly extracted coffee cells.
- Differences in flavor profiles for different particle sizes should be more stark for shorter brew times.
There’s another interesting thing we can look at with this model: How does the average extraction yield depend on particle size ? To do this, I ran a simulation at ten different brew times, from one to ten times the average extraction yield:

There’s nothing shocking here: smaller particles extract faster, and longer brew times lead to higher average extraction yields. The more interesting part is that these curves are not easy to reproduce with a simple equation. Even if we were to look at the speed at which each particle extracts as a function of its radius, or surface, the result is not a nice power law, like the naive “extraction speed” = “1 / particle surface” assumption I once made in the past. Rather, it’s a relatively complex functional form, that needs to be modelled properly instead of approximated !
The models I developed in this post will be used to translate particle size distributions into distributions of flavor profiles (via the distribution of extraction yields), in a future application I will release soon. To the hardcore geeks that made it this far in the blog post, I congratulate you two !
I’d like to thank Mitch Hale for a discussion that helped me put some order to these thoughts, and Noé Aubin Cadot for helping me with figure out some Mathematica stuff.

Hi Jonathan, love your blog…on the brew time, I wasn’t sure if your model predicted that longer brew times should allow you to practically achieve a favourable flavour profile?
Also, what have the discoveries in your blog post made you adjust for your V60 routine?
What would your favoured grind distribution be with currently available grinders (including up to say $10k grinders eg the Titus and Monoliths with SSP burrs, I understand SSP has a new filter burr based on the original EK43 coffee burr pre-2014 and the Ditting KR804 Sweet)?
Thanks for sharing all your findings
LikeLike
Thanks for your comment. I’m happy you enjoy the blog !
If my model is right, longer brew times would yield narrower distributions of flavour profiles (assuming your particles are not *too* coarse), but in order for this to be really significant, your average extraction yield will also dangerously approach 30%, which means your beverage will be bitter.
I don’t yet know what grinder is most optimal, but I don’t think this post puts into question the notion that large burrs and narrow particle size distributions are great. From my own, limited experience, Baratza Forté (steel burrs) has been my favorite one for filter brews, better than the Lido 3 hand grinder, which was itself much better than all the other hand grinders I had tried (Porlex, Hario, etc.). I have not tried a well-aligned EK43.
Most of the adjustments I made to my V60 routine yet came from teachings by Scott Rao, but keep your eyes opened for updated recipes on the blog 🙂 I’d really like to try monolith etc., but I don’t have that kind of spare change 😉 I fully expect they would blow my mind.
I will post more about particle size distributions very soon, and all the equations above will have a more practical application 😉
LikeLike
Hi Jonathan,
I too have Lido grinders, also Porlex & Hario, I can’t say my experience has mirrored yours. When dialled in to a similar recipe there is no significant difference in EY, nor in subjective preference, despite the fact I know the cheaper grinders have a wider distribution.
I have had delicious brews from the Porlex at 22%EY for drip & 25%EY in steep & release immersions.
What data do you have on the grind distribution qualities for the grinders you mention, that correlate to higher acceptable EY, independent of actual grind size produced?
Also, some coffees may have more like 35% soluble content, others 25%, so a theoretical acceptable 25%EY could be all the content of 1 bean (total percentage yield) but 71% of another? So surely, origin, roast & process have far greater potential to sway EY target?
Kind regards, Mark.
LikeLiked by 1 person
Hi Mark, that’s interesting. I don’t have objective data for the claim that higher EYs are more enjoyable with better-quality grinders that produce narrower particle size distributions. It is based on taste, in the sense that I stop at the maximum EY before bitterness and astringency kick in. My experience has been that narrower distributions tasted best at higher EYs than wider distributions, everything else being equal (roast, bean, brew method). For example, an Ethiopian I like from St-Henri tasted best at 20.5% EY with my V60 recipe and the Lido 3 grinder. I just changed for the Forté and then it tasted best at 22%. I have objective data showing that my Forté has a narrower distribution than the Lido 3, but determining where astrinrgency kicks in remains a sensory thing. I know a couple other coffee geeks that had a similar experience, but to know for sure we’d need to gather large-scale surveys about this.
LikeLike
I’ll second Mark’s thoughts here. I’m not aware of any evidence (sensory analysis) of correlation that higher EY = taste better except that some people in the industry seem to preach it. Tests done by CBI in 50s found that most people preferred a range within 18-22%. It seems it’s possible to push the preferred range higher, maybe with certain origins (i.e. Kenya) or brewing methods but there isn’t any evidence that it’s actually superior/preferred to the standard range. All grinders produce a normal/unimodal distribution at standard drip grind sizes and should be capable of hitting the preferred range with a reasonable recipe.
Also when brewing agitation plays a huge part – and from my experience has a big effect on EY.
LikeLike
Thanks for your comment Can. The only sensory survey I’m aware of is the one you mention. I do not mean that all higher average EYs are necessarily superior, but my own experience is that higher average EYs *without astringency* (i.e., made with higher-quality grinders) were more enjoyable.
In my experience, most flat burr grinders produced unimodal distributions (I actually measured some distributions, I’ll make a post about this soon), but they were very asymmetric and not normal (whether you look at them in logarithmic or linear space). I have seen some data on conical burrs that also seemed bimodal rather than unimodal. But even if all grinders were unimodal, the narrowness of the distribution varies with different grinders, and in my experience that affected the highest EYs I could reach without bitterness. I do not seem to be alone to have experienced this, I heard Scott Rao and Matt Perger mentioning a similar phenomenon, along with some other coffee geeks that I know. This may be all anecdotic, but I think there’s something to it. A large-scale survey that uses different grinders would definitely be awesome, I would expect the preferred EY range to depend on grinder (and on origin, as you mention). If such a large-scale survey proved me wrong, I would gladly accept that conclusion.
I agree that agitation plays a huge part in extraction. I did not include it in this model, because its effect are actually very straightforward: it makes the characteristic timescale “tau” much shorter for all chemical species. In reality, the “tau” I modelled here does not depend only on chemical composition, but also on the solvent and on agitation. However, both agitation and a less potent solvent (e.g. immersion brew) should affect the characteristic time scales of all chemical compounds in the same way. If you used the same coffee in an immersion or percolation, the “tau” value in percolation would be much smaller because the solvent is always at low concentration and more potent for extraction. Intuitively, I do not think that either agitation or immersion vs percolation will change the “exponentially decreasing” functional form for extraction rate, but that will need to be tested – it’s the main hypothesis in the model I presented here, so it definitely needs to be tested anyway 😛
LikeLike
Re Mark and Can posts…this is something I’m really interested in…it seems the professionals you mention (Rao & Perger) have this “highest EY without bitterness and/or astringency” as their holy grail to reach say 28% without bitterness and astringency and this will be the best sensory experience. But there is a cliff where there’s no bitterness and astringency but flavour goes flat at certain EYs. Not saying Rao & Perger Et al are wrong, just that it is not a universally held hypothesis, and I don’t have the time to test it out myself methodically, but I know Mark and Can have.
I’m wondering if there’s anything that can be done to preferentially extract “good” tasting compounds while avoiding “bad” tasting towards the end of extraction?
Can and Mark, what have your findings been on how agitation affects brews (and therefore what is your approach to agitation with V60s) and temperature (eg could drastically reducing temperature at the end of the brew continue to pull out sweetness without bitterness/astringency?)
Thanks for the discussion, I know I’ve asked similar questions on Coffee Forums UK but good to have Jonathan involved too!
LikeLike
Regarding unimodal distribution, I was referring to the LPA done by Ditting here:
Click to access VIRTUOSO-graph.pdf
This is a small conical grinder (Virtuoso), smaller burrs than your Lido, and you can see that the secondary hump mostly exists in espresso range, and disappears as you move coarser. I believe this secondary hump is necessary for traditional espresso brewing to slow down flow.
My experience noted above strictly relates to drip as that’s how I brew 99% of the time. I believe Matt & Rao have more interest in espresso so I can’t really relate to my experience there and obviously the commercial market for espresso grinders and equipment is far larger.
Have you tried a like by like comparison with your Lido and Forte? By dialling both in and tasting side by side (if possible?)
Regarding agitation – my experience is that it depends a lot on type of brewer, some brewers almost require it (Melitta or V60) and some not as much (Kalita). But I don’t have a good explanation either way.
LikeLike
Yes, that’s actually a graph I had in mind when I mentioned the peak of fines. The coarse one is what I’d call a unimodal distribution (not gaussian or normal though), but the finer grind settings produce what I’d call a bimodal distribution (there are two local peaks). From what I understood, this secondary bump in fines is more pronounced for conical burrs but also exists for small burrs to a lesser extent. Take this with a grain of salt cause that’s just hearsay. I haven’t measured any distributions down to these very fine sizes because I use imaging analysis and they just don’t come out on a picture.
I agree that Matt seems to focus more on espresso but I think it’s not right about Rao – his first book focused more on espresso, but most of what I see him discussing recently is drip, and I think he said somewhere that he also prefers drip to espresso. I definitely wouldn’t say that he’s more focused on espresso.
I did try a like by like comparison btw Lido and Forté; I blindly converged to a very similar average particle surface (I did imaging analysis on both after having dialled them in). At the same average surface, the scatter in particle mass vs surface was about 2/3 smaller for Forté than Lido, and produced a higher EY, higher TDS beverage that I really preferred. I tried that with a few Ethiopian coffees. With Lido 3 I had converged to EY~20.5% and anything higher was astrigent. On Forté 20.5% tasted dull and I converged to EY~22.5% which tasted much brighter than the dialled in Lido 3.
LikeLike
I should also mention that using very long brew times put you at risk for oxidation, but I have done no test about this.
LikeLike
Would it be possible to estimate the extent of oxidation? Do you know of research or just coffee heresay (links?) on how and how fast oxidation would affect the flavor?
LikeLike
It would probably be possible, yes, but I’m not sure what kind of equipment would be needed. I remember reading that it’s a problem for cold brew, which uses brew of several hours, but I don’t know approximately when it kicks in and how it depends on temperature. Sorry I don’t really have answers to your questions !
LikeLike
PS a better description than in the Youtube video of Perger’s Barista Hustle experiment is in the Coffee Podcast interview, quite a compelling argument, perhaps using much finer grind sizes but having to use immersion as will be too fine for filter… https://www.thecoffeepodcast.org/all-episodes/e129-coffee-myths-extraction-with-matt-perger be interesting to try immersion brews with a particle peak at 200 microns
LikeLike
Thanks ! I actually discovered this podcast from Matt’s Instagram less than 24h after I published this post 😂 I found his discussion really interesting, and indeed a bit more detailed than the Youtube video. I think we need more experiments like that one, more details in my next blog post 🙂
LikeLike
Hi Jonathan,
You mention “higher quality grinders”, but no tangible pointers to what that quality is? It seems you are using price as a synonym for quality?
At coarse settings both flat & conical make unimodal distributions, at espresso settings both flat & conical make bimodal distributions.
A large scale survey would be great, but if professionally done, who will pay for it? It could be carried out by home users & we could post our results on a google form, but I think the lengthy list of conditions to make this meaningful, would make this unattractive to most (I’d do it, if a format could be agreed).
@bytheway agitation depends on coarseness of grind. If you are drip brewing on the finer side, stirring or swirling the bloom/slurry is a good idea to ensure even wetting & flow through the bed/slurry. Brewing at the coarser end, the pour from the kettle will be enough agitation.
For immersion, get all the coffee wet as quickly as you can, anything more can just increase the non dissolved content of the cup (usually more bitter). It can help you reach a certain point of extraction, around the knee of the curve quicker, but it can’t increase terminal extraction (all else being equal).
I always brew with boiling water at bloom/1st pour.
LikeLike
Oh I thought it was clear in the article that by “higher quality” I mean “more consistent grind size” (narrower particle size distribution). I absolutely don’t mean price, although there is some correlation (I would never choose a grinder based on its price).
That makes sense to me regarding unimodal/bimodal, with the exception I had heard conical were more bimodal than flat burss, but that’s just hearsay so it could be entirely wrong. I think it would be possible to do such a survey and keep the questions short (e.g. whats your grinder, whats your preferred tds and ey, whats your brew method). I don’t think I have enough followers yet to gather a really large amount of data though, but I’d be willing to help if I can.
That’s interesting about agitation vs grind size. That may explain something I’ll post about soon 🙂
LikeLike
Hi Jonathan, sorry my post probably didn’t have the right tone regarding grind quality/price, I appreciate entirely that is what you meant, all I’m saying is that without tangible datums on what is abnormally wide/normal/abnormally narrow regarding distribution, the only thing people can ‘see’, or guage performance by is price.
LikeLike
I see, yes I agree, and I want to change that soon 😉 in that post I was talking about quality in a more theoretical sense, i.e. if your grinder is more uniform, there the effect would be X.
LikeLike
Thanks Mark, what are your thoughts on the Barista Hustle “experiment” (very small sample size hence quotation marks). It does make sense that if water can only penetrate 100 micron deep, therefore for a sphere (which is not reality) particle sizes > 200 micron will have 0% extraction parts to it. Hence as you grind coarser, the actual weight of coffee accessible for extraction goes down, so actually if you have a 20% EY, but brew A has a finer grind than brew B, then brew B is actually extracting more from the cell fragments / intact cells that are penetrable…bit confusing but maybe listen to the podcast and the YouTube video on the Barista Hustle channel and would be interested in thoughts. I’m no Perger fanboy but it’s an interesting model
LikeLike
@bytheway I have more questions about the experiment than it claims to answer. The extractions even with 250um particles were quick but not particularly high. My drip brews (where water more aggressively washes the surface of the particles, compared to cupping) still range from 18-22%EY +/- a little, even though particles are typically 85% over 500Kruves (if you sift the same sample with Tyler/ASTM sieves you get different results to Kruve, so I don’t see that Kruve measurements are interchangeable, even though Kruve is very repeatable.
Cuppings & other static immersions are generally clamped regarding extraction by 2 main factors: dropping water temp losing energy & the fact there is no mechanism to drop the TDS of the liquid in the grounds to lower than that in the rest of the cup.
A very quick, very fine immersion brew might be great, but by the time you have clarified it, you may as well have ground coarser & made a V60. Or, carry on drinking Turkish coffee 🙂
LikeLike
I’ll talk a bit more about percolation vs immersion in my next post, in this context. I think immersion just has a slower “tau” than percolation, but that remains to be verified. Also BH used plastic bowls for their cupping so heat loss is a bit lower than usual (there’s still loss from the opened top). I’m not convinced the cupping bowls from their experiment actually tasted good 🙂
LikeLike
Few things…
-I would say Perger is more interested in non-espresso from a personal perspective (Barista Hustle has to be focused on espresso more for commercial reasons)…I live in Melbourne and have seen Matt Perger at cafes over a dozen times, he only drinks filter while he’s there
-I’ve read somewhere Scott Rao doesn’t really drink espresso for enjoyment?
-Mark, regarding the Barista Hustle experiment, I was meaning that if you enjoy 18-22% EY for example, that if you ground finer (not suggesting that you should do this in any way whatsoever), then you would probably enjoy higher EYs because at present with a coarser grind, there’s probably a lot of “dead weight” in your coffee dose that has 0% extraction…I think that’s probably the best hypothesis one can take from the BH experiment, that true EY at particle sizes used in filter coffee is probably impossible to accurately calculate (not withstanding that EY is still a good way to track your method and preferences as long as you don’t change your grind too much). This is of course if you trust the BH conclusions at all!! I didn’t actually check the math they used, and yes immersion is not what most of us are doing at home, so who knows what is happening with pour over filter!!
LikeLike
Interesting ! I’m surprised about Matt preferring filter, I probably mixed things up with Chris Bacca or something.
For your third point, in a vacuum I agree with this, but for V60 for example there are flow considerations that may change the picture. I don’t have a strong opinion about it but I won’t be surprised if it becomes harder to avoid astringency at finer grind size with the same V60 method.
LikeLike
Hi Jonathan! Yes of course, I agree you can’t translate the BH immersion data to filter because of many factors, flow and more potent solvent (ie fresh water re-establishing the concentration gradient) being the two biggest factors that come to mind. Also the difficulties in actually filtering finer grind sizes due to clogging the filter…
Great discussion
LikeLike
@bytheway – I do grind at different sizes, for differing protocols, with drip. A fine grind (<500um avg) for a long bloom & all water straight in with a regular kettle. A typical drip grind (700-800um avg) for gooseneck kettle poured brews. Very coarse (900+um avg?) for brews with lots of little pulses.
All these methods average somewhere 18-22%. The fine grind brews inhabit the same span as the typical grind. The highest good tasting EY seems to drop off a little for the coarsest brews, say spanning 17-21%. If there are brews with particles of 0% extraction, then I'm not seeing a stand out indicator of threshold here…looks to me like they all do, or none do (probably none, as if you grind coffee & pass17x the weight of water over it, you're unlikely to extract less than 13%EY)?
I did get excited at one point when I was hitting 23% EYs with V60 & very fine grinds, they were a little dark tasting & when I syringe filtered the sample they lost a couple of % & dropped back to normal range. They were faster to brew, but didn't taste any better, or as good as typical brews.
LikeLike
Really awesome post, I made some poor illust about this a few years ago, and really honor to meet to talented scientific coffee geek like you.
LikeLike
Nice thanks !
LikeLike
Hi Jonathan,
Have you considered adding the grind size distribution to your model? Besides I know a very nice app to measure it 🙂 Seems this is just another sum in your equations. This would make the model a bit more accurate, IMHO
LikeLike
Hi Andrew, yes I actually wrote this to eventually add it to the grind size app, so that I can give an estimate of how non-uniform the extraction will be based on grind size distribution 😛
LikeLiked by 1 person
hi jonathan,
im trying to replicate the model and i can match your results through the figure showing how extracted mass % depends on t/tau for different layers, but im having trouble matching your results once you sum each layer for the total particle. its not clear to me how the sums/integrals work out with the geometry factors so that youre able to normalize to % mass extracted. i think im not understanding something along the way because its also not clear to me what role “s” plays in the continuous case because its only in the constant term. using the equations as presented, i tried solving for the 1000 micron particle and normalizing to the t=inf value and im only finding about 60% mass at 10 t/taus (for both the discrete and continuous case ) while you show it reaching 100%.
LikeLike
Send me an email through my contact form, I’ll dig up the code and share it with you
LikeLike