In a recent post, I presented a mathematical model for the dynamics of coffee extraction that is based on a few simple hypotheses. One of these is that the rate of extraction decreases exponentially. The rate at which it decreases can depend on many things: the type of coffee, the roast, the amount of agitation and the brew method would be examples that affect how fast the rate of extraction goes down. For example, in an immersion brew, water becomes gradually more concentrated, and it thus becomes less efficient at dissolving coffee. We should thus expect the rate of extraction to decrease faster in an immersion brew, compared to a percolation, even with the same exact coffee. How fast the rate of extraction goes down is what we technically call a free parameter of the model: the model itself makes no prediction on its value, and can accommodate any number.
One thing that the model crucially lacked until now is being tested against real-world data. As a scientist, I don’t like to leave something floating without testing it, and I want to see how many teeth it loses when it faces the real world. Hence, I didn’t lose too much time and tried to apply it to the data recently gathered by Barista Hustle. As mentioned earlier, an aspect I did not explicitly include in the equations of the model is the effect of fines. The maths behind them is boring, because I make they get extracted to the maximum as soon as they touch water, but I do include their effect to model real-life data. My model makes no prediction about how many fines there are in a given brew, so their proportion is yet another free parameter.
For all those of you new to this, what I’ll attempt here is called fitting a model to experimental data. It’s a game we often play in science: build a model based on some assumptions, which has a few free parameters (think of them like knobs you can adjust to get a different result). Take a set of real-life data, and try to reproduce exactly the same data by playing with your free parameters. If the model is good, you’ll be able to adjust the free parameters such that the model looks a lot like the data. If you have a really large number of free parameters, you will be able to reproduce any kind of data, and your model becomes very poor at making any kind of predictions – in that situation you will even be unable to test whether your starting hypotheses were good or not.
This might all seem a bit abstract, but I think it has the potential to unlock some important understanding about coffee brewing, which I hope will inform us on new ways we can experiment with brew methods and recipes.
Because we will now explicitly work with the Barista Hustle data, I want to remind readers of what their experiment was. They ground some coffee, and sifted it with a Kruve sifter set up with the 250 micron and 500 micron sieves. They thus ended up with three groups of coffee grounds; those that went through the 250 micron sieve (i.e., with diameters smaller than 250 micron along at least one axis); those that went through the 500 micron sieve but not the 250 micron sieve; and those that couldn’t pass even the 500 micron sieve. Depending on how long they sieved, and how much static electricity was present in the grounds, we should expect that some grounds fine enough to pass a given sieve might not always have passed it, but the global result will still be that they end up with three piles of grounds, which average sizes will be (1) smaller than 250 micron, (2) between 250 and 500 micron, and (3) above 500 micron.
They then weighed the exact same amount for each kind of grounds, and placed them in three distinct cupping bowls. They added hot water, and took samples out of the cupping bowls at distinct times. They then measured the concentration of their samples, and worked out the corresponding average extraction yield in the usual way. They got the following result:

So now, the question is – can my model fit this data ? What we have here are 18 data points, but those at t = 0 are really a given (no water = no extraction), so we really have 15 data points to model. When you play the game of model fitting, it is very important that you have less free parameters than the amount of data points. In my case, the model has 9 free parameters, here’s what they are:
- The average characteristic time scale of extraction (τ)
- The characteristic depth that water reaches in coffee particles (λ)
- The maximal extraction yield that this coffee can reach
- The average diameter of particles in the first bowl
- The average diameter of particles in the second bowl
- The average diameter of particles in the third bowl
- The mass fraction of fines in the first bowl
- The mass fraction of fines in the second bowl
- The mass fraction of fines in the third bowl
The first three parameters are required to be the same for all three cupping bowls, because I assumed they use the exact same brew method, and the same agitation in all cases. We also know they used the same coffee and water in all cases. Now, I want to remind you of the hypotheses my model relies on. Any one of these being false will potentially hurt the model’s ability to represent the data.
- The rate of extraction decreases exponentially for each coffee cell.
- The rate of water contact decreases exponentially with the depth of a coffee cell.
- All coffee particles are perfect spheres (the model actually doesn’t change much if you remove that hypothesis).
- Coffee cells are cubic with a side of 20 micron.
- Each bowl contains some fines plus a set of perfectly uniform coffee particles.
- All available chemical compounds get immediately extracted from fines.
We in fact know that some of these must be false (e.g. spherical particles), but it will be very informative to see how well the model fares despite this. Make no mistake: making simplifying assumptions is a very powerful tool in science. It allows you to verify which aspects of an experiment are most important in explaining the outcome, and which aspects have a lesser impact. It is important to bear in mind that the model is a simplified version of reality, but it does not make it useless.
Now, we need to use a recipe to adjust the 9 knobs (the free parameters) of our model in a way that makes it look the most like the data. There are several ways to do this, and this is one aspect of science that I have a decent amount of experience with – a method I really like for this is called a Markov Chain Monte Carlo sampler. The details of it are quite technical, so I won’t go into them. Instead, I will provide you with a simple analogy, that I think is kind of accurate. Imagine the model is a blackbox machine with 9 knobs, and the goal is to adjust each knob individually to reproduce the data the best you can.
A Markov Chain Monte Carlo sampler is a bit like having a hundred monkeys with their own respective blackboxes, randomly tweaking the knobs and judging if the data fits the model. When the model of one monkey starts resembling the data, it starts getting agitated and yells, which gathers the attention of some other monkeys. They get jealous and notice how the successful monkey has adjusted its knobs, and they try to adjust theirs in a similar way, but they don’t do it perfectly. Some monkeys are harder to distract and they keep exploring very different combinations of knobs, until there is a turnaround point where so many monkeys are yelling that really all monkeys are starting to converge on a similar set-up. This moment is called the end of the burn-in phase in technical terms. Once it is reached, you can let the monkeys keep playing with the knobs for a while, and carefully pay attention to what knob combinations they try. At that point, most of what they try will be very close to the best solution. If you gather enough observations despite all the yelling, you will be able to tell what their average knob setting was, and how much they swung each knob around after the burn-in phase. From mathematical considerations, these two aspects will correspond to your best parameters as well as measurement errors for each parameter value. This method is very powerful at exploring all different combinations of knobs, while paying more attention to the combinations that produce better results.
So, I let my hundred computational “monkeys” try 4000 combinations each – the point where all of them were yelling loudly was reached well before the first 1000 combinations, so I paid attention to the last 3000 combinations to determine what the best parameters were. Here’s what the best combination generated:
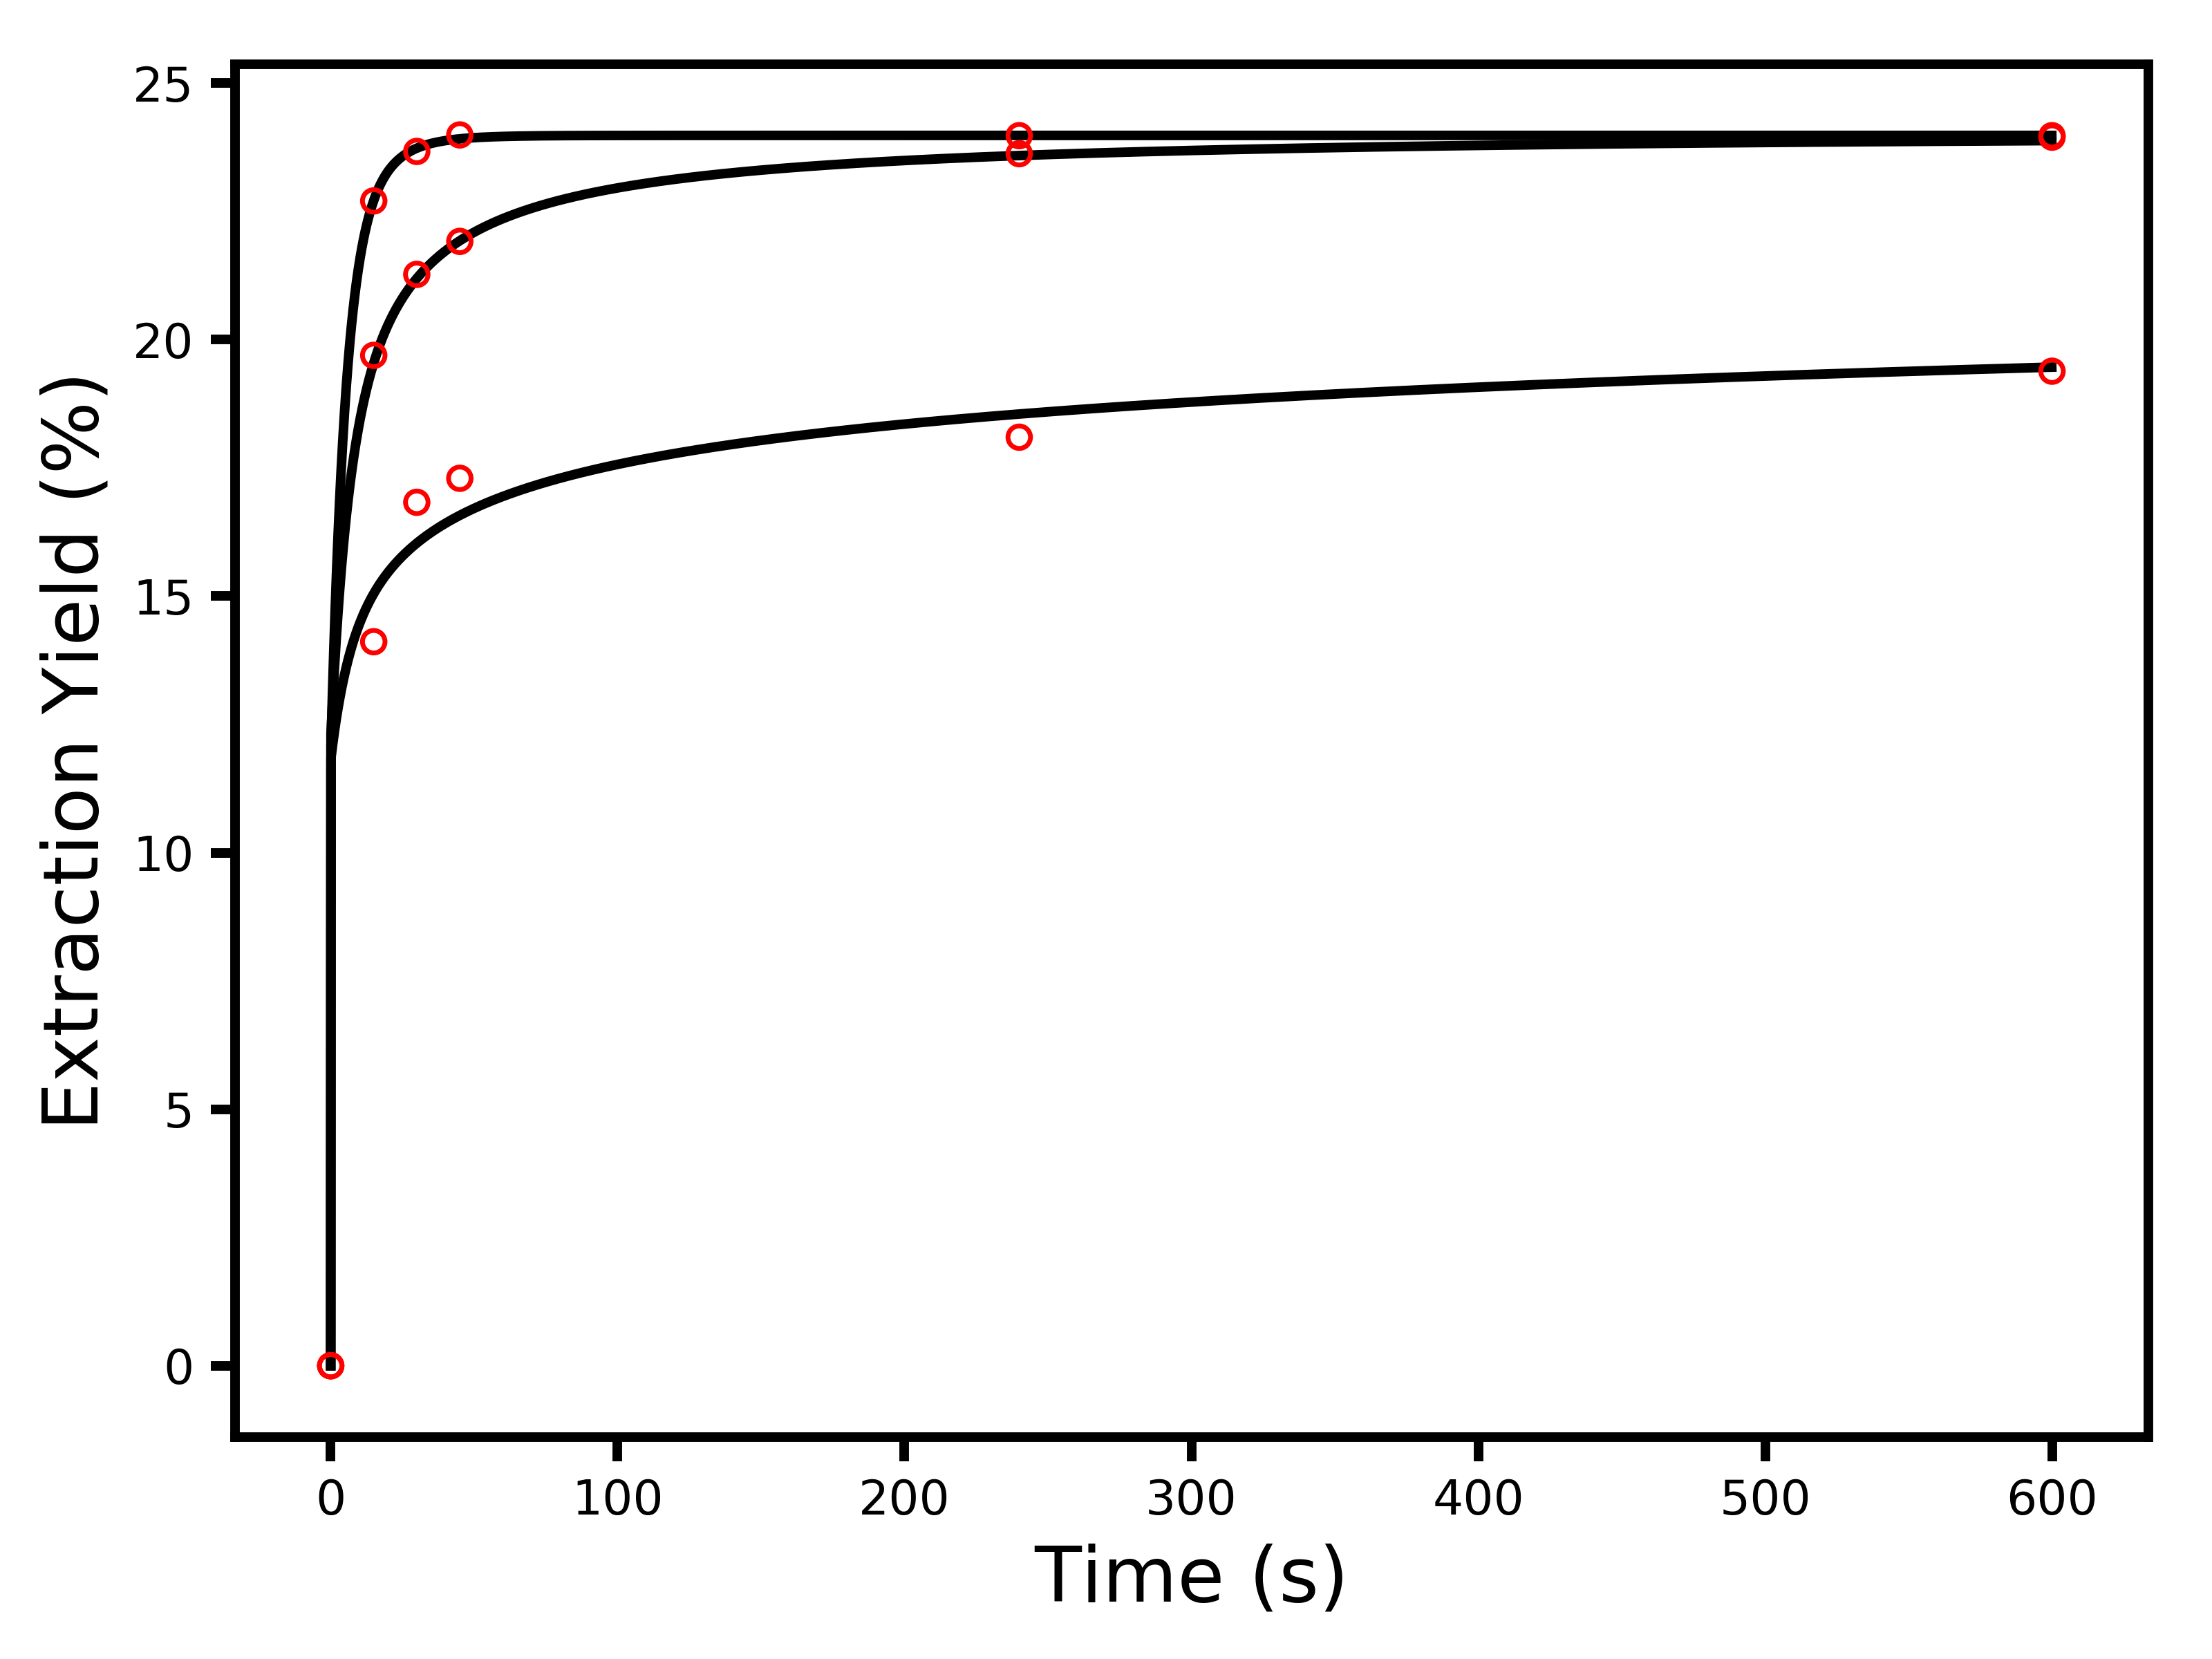
In all honesty, I was really surprised at this – I expected the model to do much more poorly. You can see that the first cupping bowl with the coarser particles (lower average extraction yields) does not fit as well as the other ones, so whatever effect makes the model imprecise is more pronounced for coarser particles. I suspect this may be related to the fact that each cupping bowl has a distribution of particle sizes and shapes, rather than a very uniform set of particles. Now, let’s have a look at what the best values were for the free parameters, and their measurement errors:
- Maximum extraction yield: 24.0 ± 0.1 %
- Characteristic extraction time: 5 ± 2 s
- Characteristic depth reached by water: 35 ± 8 micron
- Average diameter of particles in bowl 1: 1400 ± 300 micron
- Average diameter of particles in bowl 2: 420 ± 70 micron
- Average diameter of particles in bowl 3: 140 ± 60 micron
- Mass fraction of fines in bowl 1: 49 ± 4 %
- Mass fraction of fines in bowl 2: 50 ± 10 %
- Mass fraction of fines in bowl 3: 50 ± 30 %
The characteristic depth reached by water is smaller than what Matt Perger estimated (100 micron), but I am using an exponentially decreasing reach of water, while he assumes that water accesses the coffee cells equally well down to 100 micron, and then not at all in deeper layers. Matt’s estimation of a 100 micron depth corresponds to the layer where only 6% of water reaches in my model.
The characteristic extraction time is very short, at 5 seconds. This means that, if you were to leave intact coffee cells in a cupping bowl in direct contact with water (i.e., each coffee particle would not have any coffee cell hidden under a surface), you would extract ~63% of all available compounds in just 5 seconds ! This is illustrates of how important it is to consider the effect of coffee cells being hidden under the surface of a coffee particle, as we need much more than 5 seconds to be satisfied with a cupping bowl.
To me, the most surprising parameters were the mass fractions of fines in each cup. They are huge, and almost constant across particle sizes ! I was tempted to make the assumption that each coarse coffee cell has a thin layer, half a cell thick, with broken coffee cells that act like fines. But what we have here is something entirely different: a whopping 50% of all coffee mass seems to be trapped in fines that extract immediately, even in the cupping bowl with coarse particles ! Here’s a hypothesis that I think could possibly explain this – I did not come up with this, but saw a comment that Scott Rao made somewhere about this: a lot of fines may be sticking to the surfaces of coarser coffee particles, possibly by static electricity. It’s also possible that some fines did not have time to migrate through the sieves during Matt’s experiment, even though they were freely hanging out among the coarser particles.
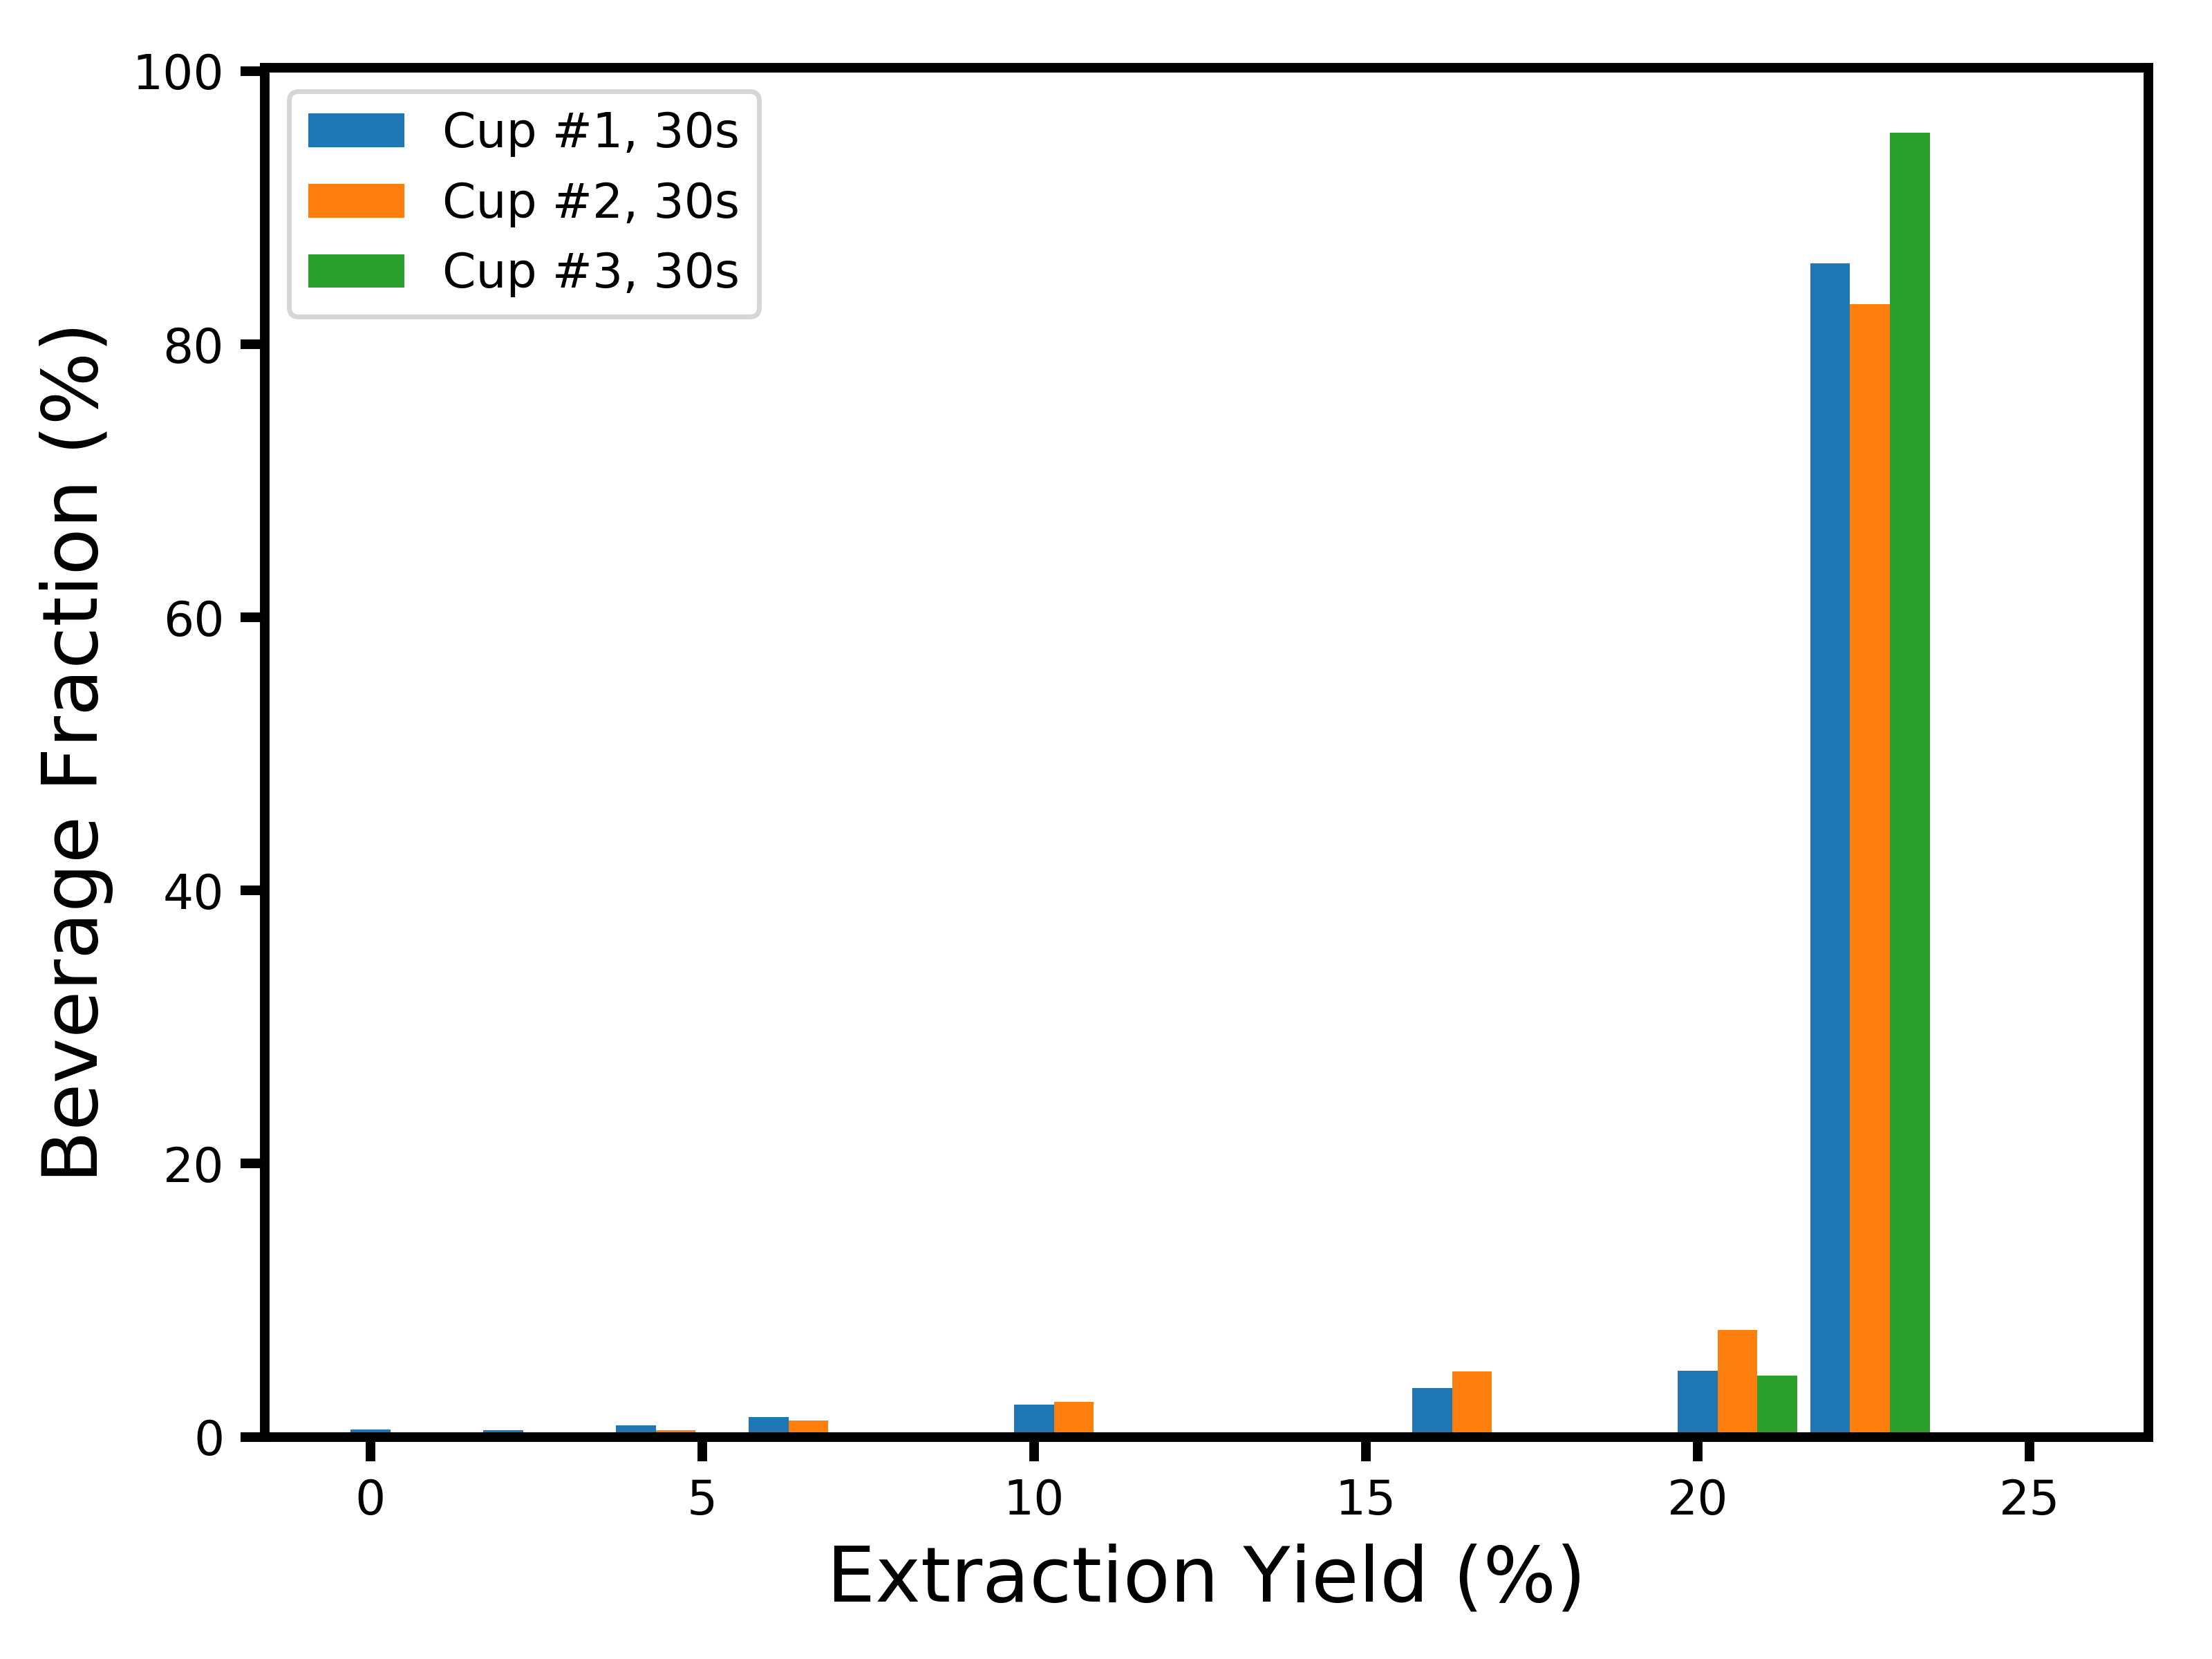
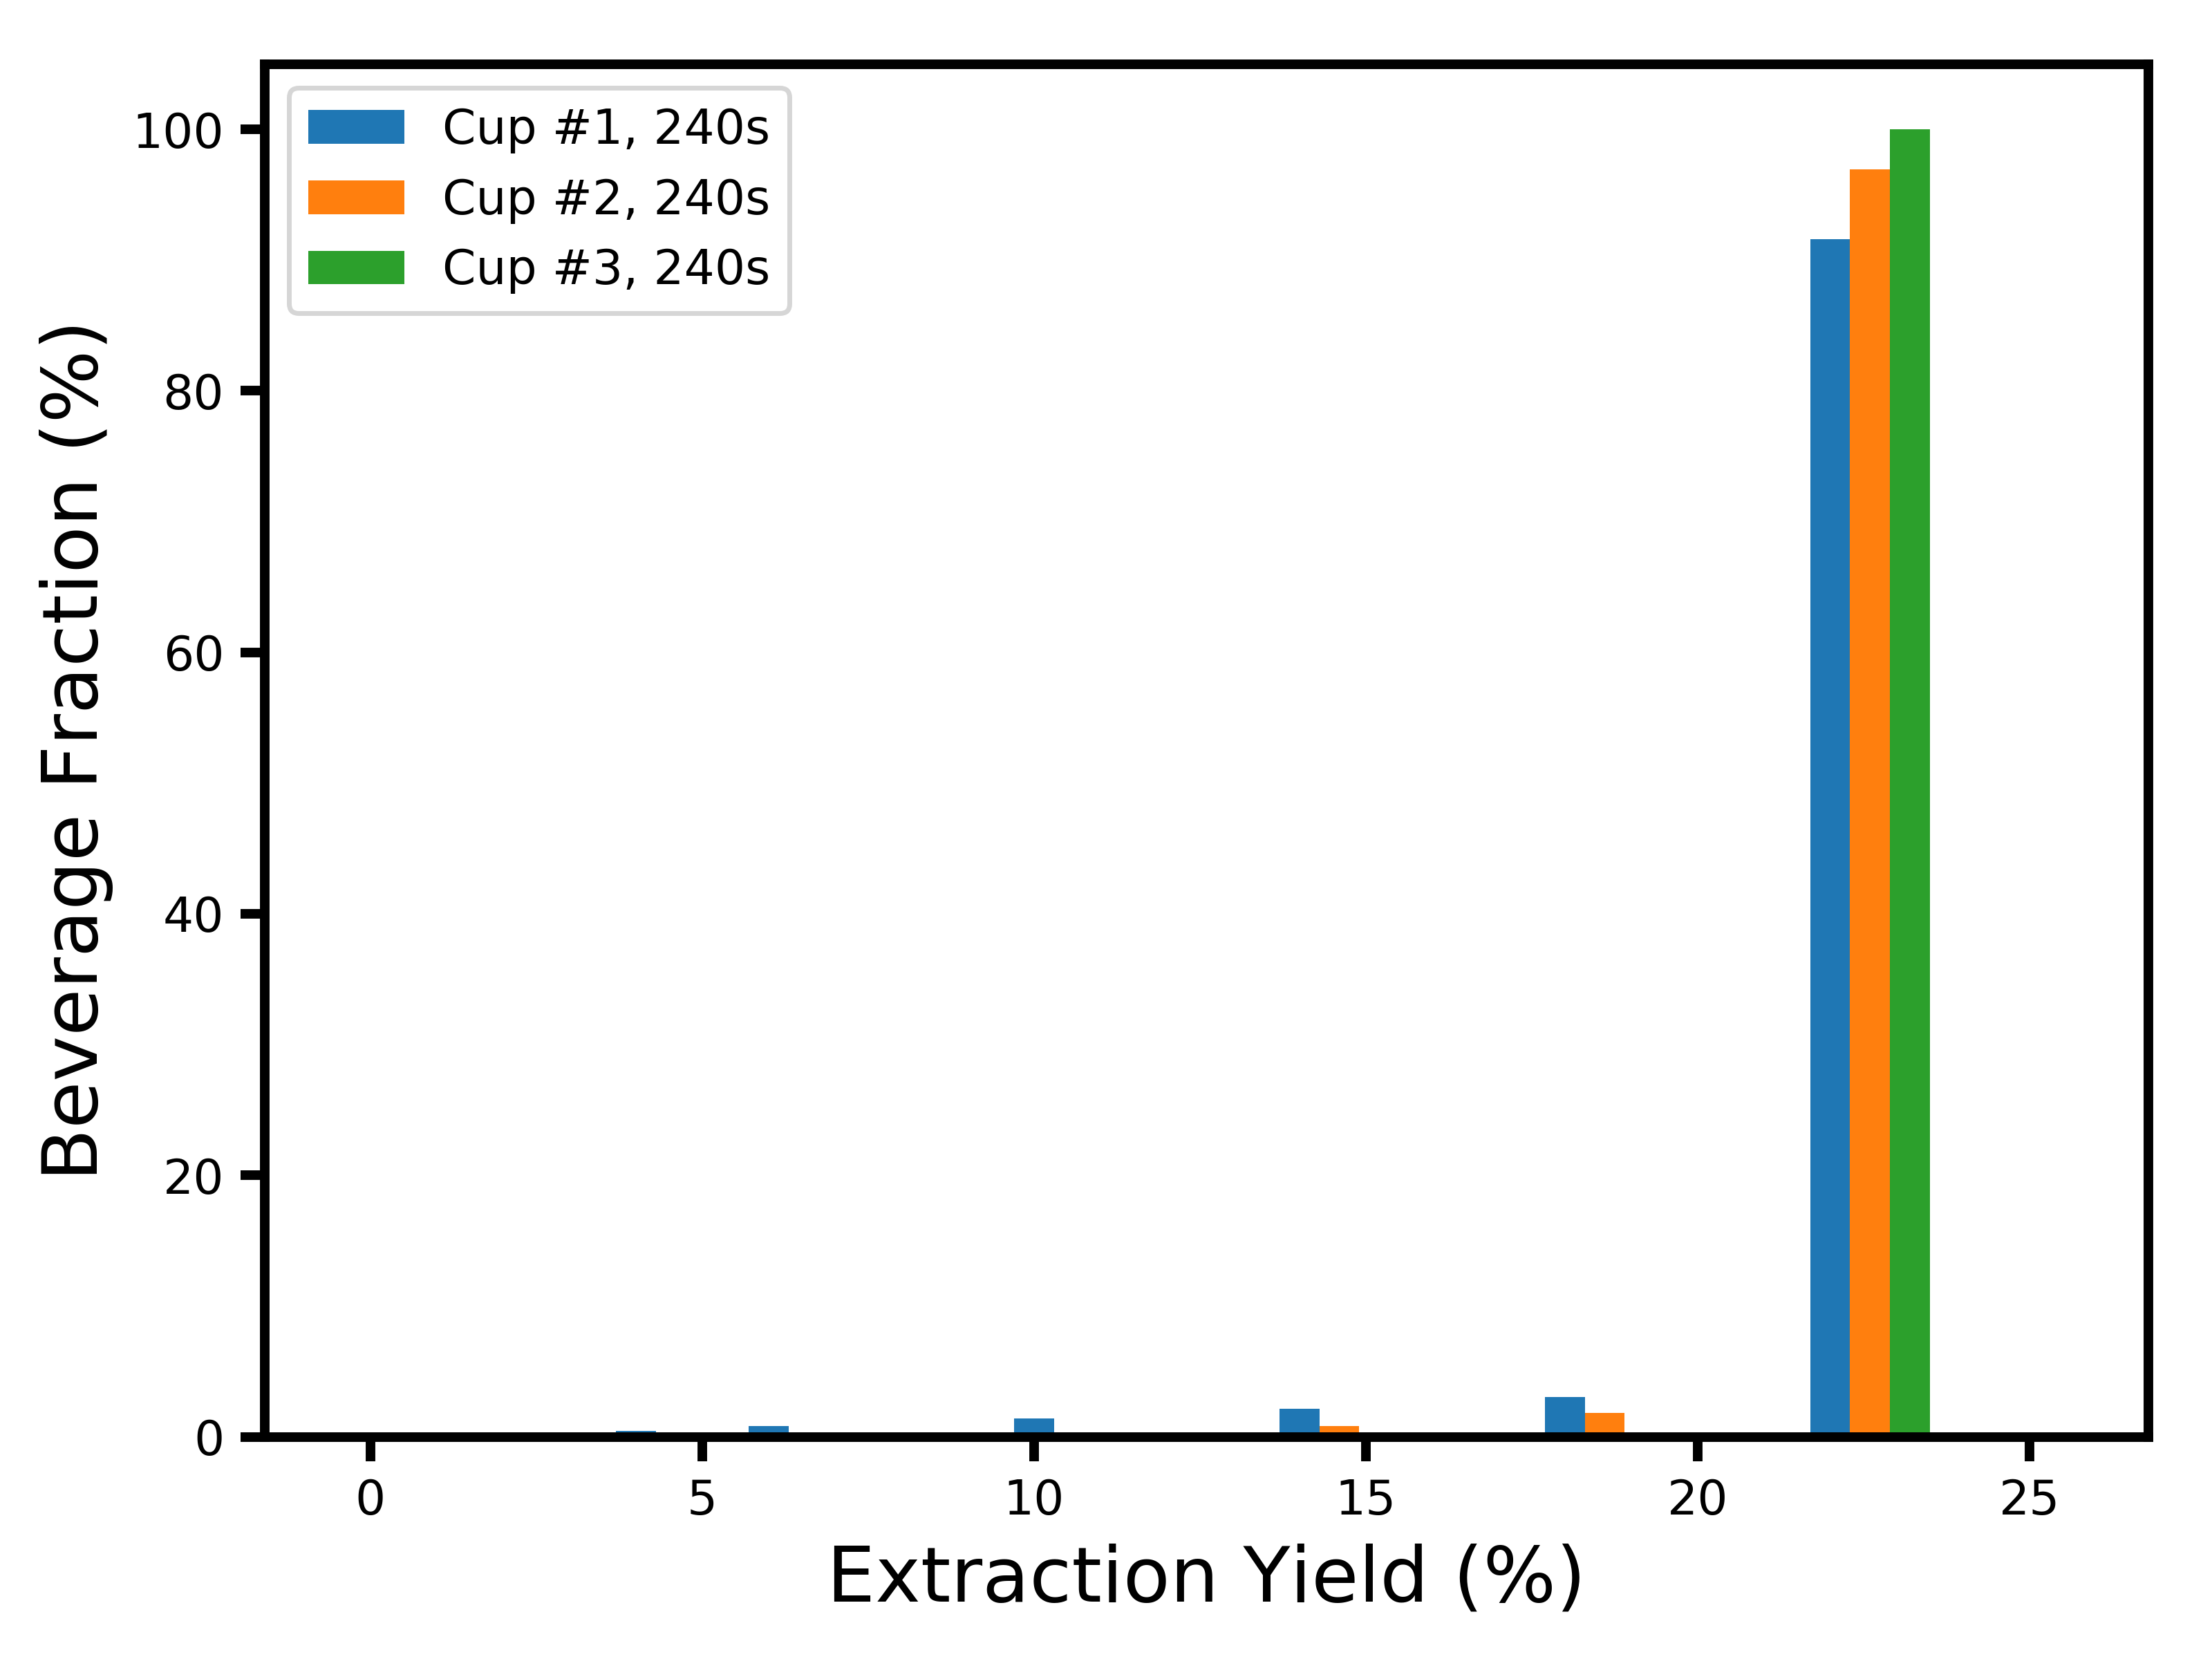
Now, it would be unfortunate to just stop here. The main driver behind why I started worrying about the dynamics of extraction was the question of flavor profile. Since we do not have sensory data to play with, the best we can do is approximate it with a profile of extraction yields. Now that I have a model in which I know how many particles there are of each size, and how fast each layer extracts, it becomes possible to build a distribution of extraction yields for each coffee cell. An even more interesting thing we can look at is the extraction yield profile of each drop of coffee in the resulting cup. To obtain this, we just have to look at how much mass was extracted from each coffee cell, and what its corresponding extraction yield was. We can do this for each cup separately, and at each moment where Matt sampled the cup. Here’s what you get at the first sample collection (15 seconds):

Don’t be surprised that nothing shows up at 0% extraction yield ! This is a distribution of what actually landed in the cup of coffee. While a lot of coffee cells were extracted at 0% because they were near the core of a coffee particle, the “brew” that is 0%-extracted just did not contribute to the cup of coffee. What you are seeing here is a combination of two things: (1) a profile peaking at ~21% extraction yield with a long tail to the lower extraction yields, which corresponds to the stuff that was extracted by diffusion (you might recognize these shapes from my last blog post); and (2) a large peak at ~24% extraction yield, corresponding to the fines which immediately extracted by erosion.
There is something shocking to me about this distribution: between 70 and 80% of the liquid in the cup comes from coffee cells that were fully extracted ! This lends a lot of credence to Matt Perger’s claim that high extractions do not necessarily taste bad, as well as Scott Rao’s comment that fines play a crucial role even if you sift your coffee. This is however confusing to me for one reason: where does all the bitterness and astringency come from in over-extracted brews, if a cup mostly extracted at ~25% tastes good ?
While I do not yet have an answer that I find satisfactory to this question, here are a few hypotheses that I’d like to throw out here:
- Maybe the bitter and astringent compounds have a much slower extraction speed and account for a very small fraction of the mass.
- Maybe the presence of bitter and astringent compounds is explained by something else than high extraction yields. That something else would need to correlate with extraction yield, because we know that astringent and bitter cups have either a higher average extraction yield, or a more uneven extraction yield which caused a larger fraction of the brew to be highly extracted. This is closer to Matt’s explanation that you get bitterness when you “beat up” your coffee too much. No offense to Matt, but I’d really like to find a more precise and scientific description of this process 🙂
- Maybe something is flat wrong with my model, and the fines are not the entire explanation for the very quick rise in average extraction yield in the first sample at t = 15 seconds. It would then be surprising that the model reproduces the data quite well.
Whatever the answer is, I think we need to do more experiments like this one. Having a much finer time sampling especially at the start in our data collection, and going to much longer times especially for the coarse cupping bowl, would be super useful to get better constraints on what’s going on here. This was extremely illuminating to me, but as usual in science, it brought a few answers and many more questions !
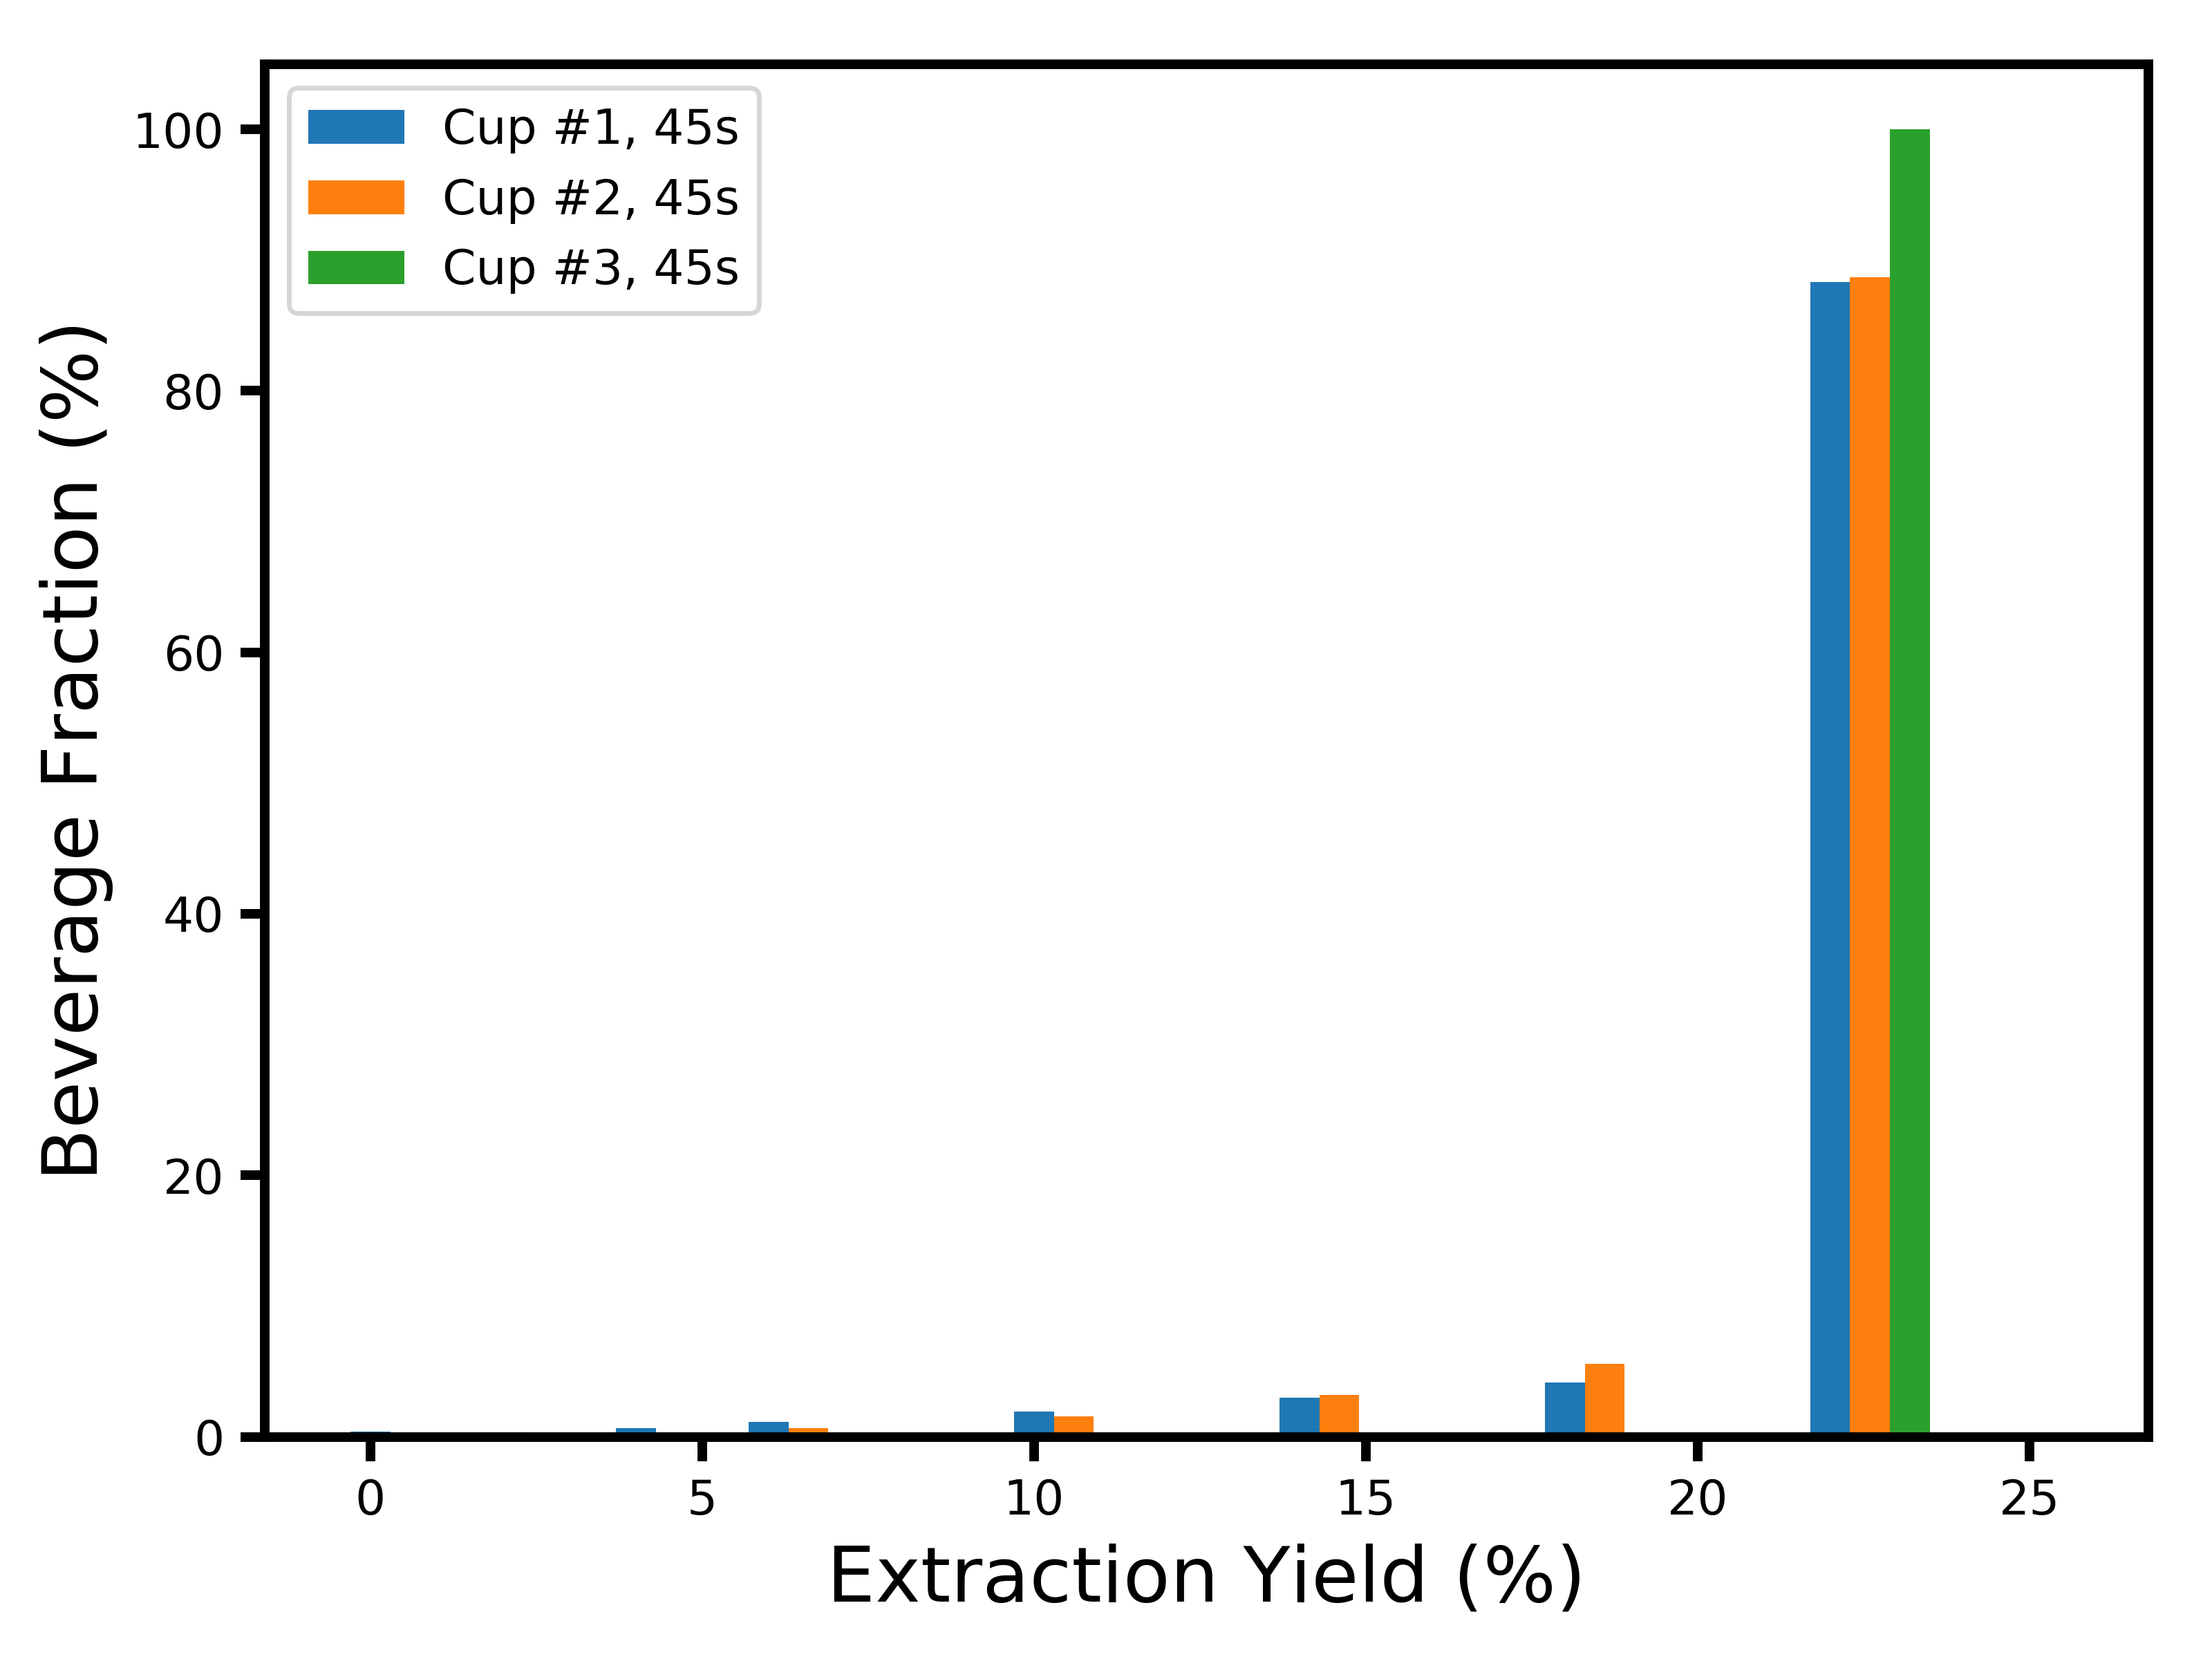
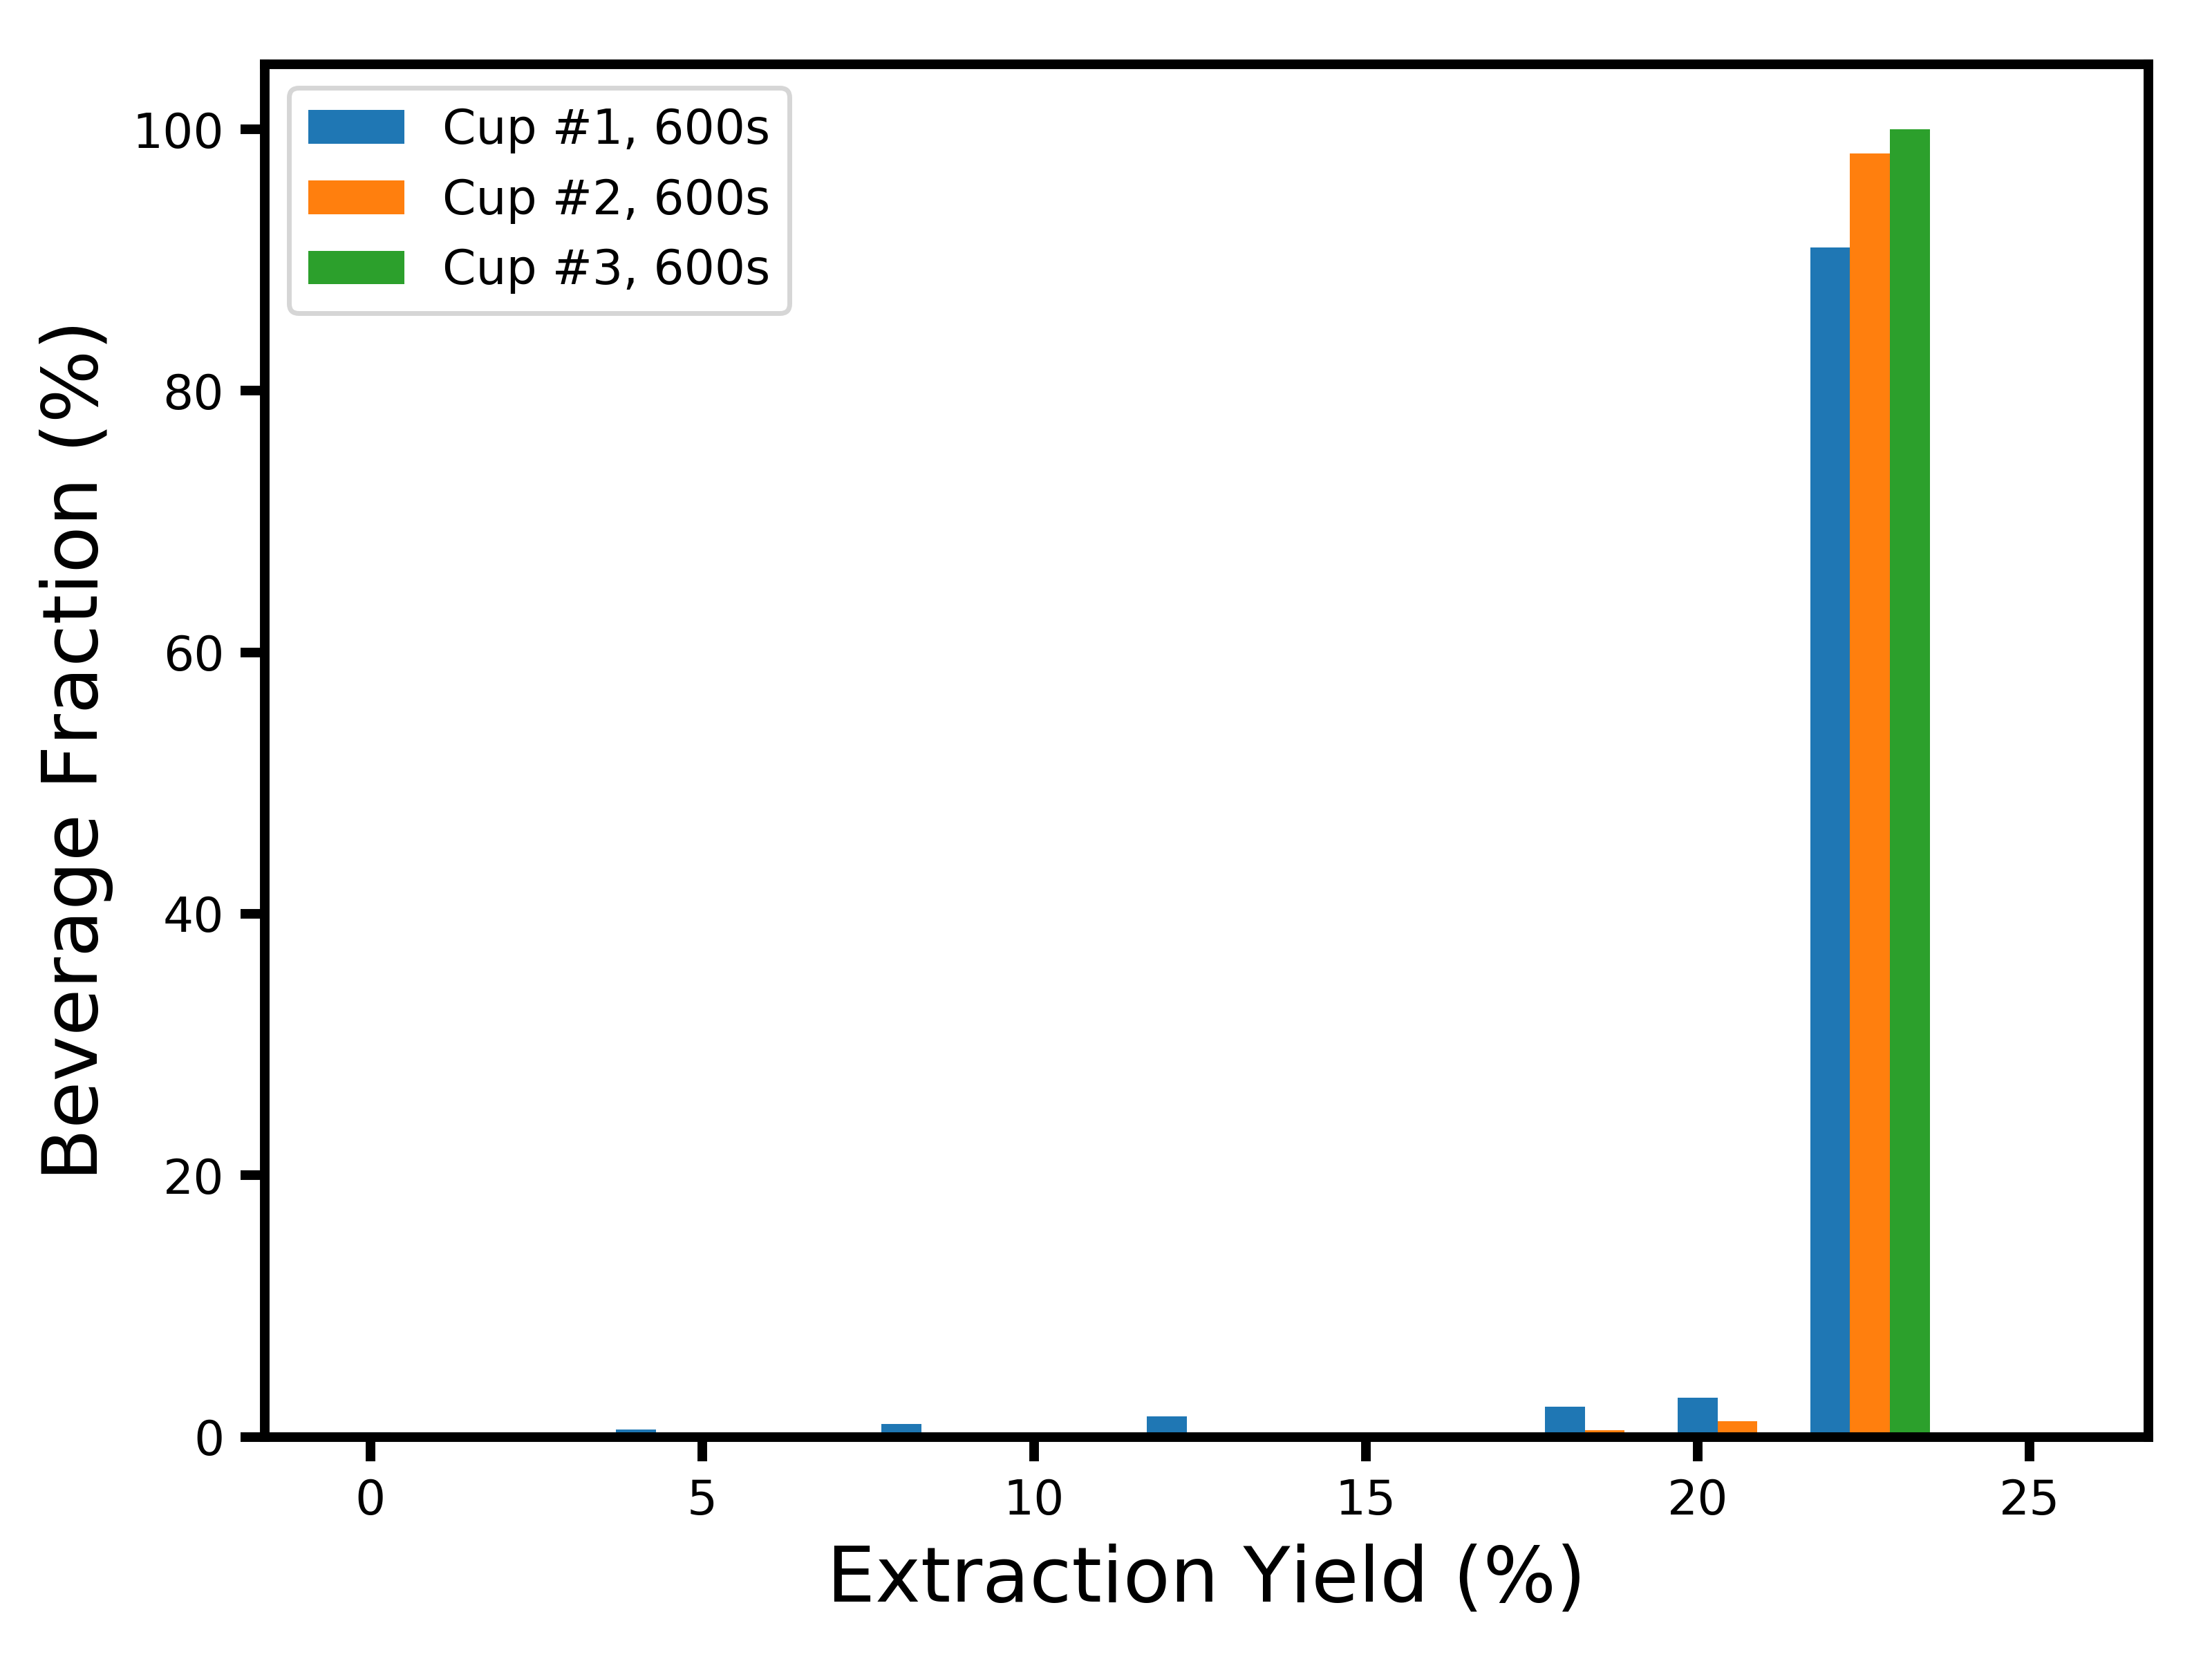
If you’re curious about the extraction yield distributions at later times, here they are:
I’d like to thank Mitch Hale, Can Gencer, Mark Burness and Scott Rao for useful discussions.
The header image is by Alexandre Bonnefoy at Issekinicho Editions, Strasbourg, France.

The claim that water doesn’t penetrate more than 100um doesn’t seem realistic at all to me, water is a very small molecule and can find its way through almost everything. Imagine you’re boiling something like spinach and it will shrink several times in volume in a matter of seconds, because it’s 90% water.
I did a quick experiment – I took some coffee beans , a few as whole, a few chopped in two and a few chopped in four and put them in a cup with boiling water. After just a few minutes the pieces which were chopped in 4 and some of the halved ones have sunk to the bottom – indicating they had absorbed enough water to sink them and when I split them I could see they were soaked all the way through. The whole bean was still floating, so maybe you still at least need to break the bean in a few pieces.
LikeLike
Hi Can, thanks for your comment, this is interesting. It is possible to have water penetrate the coffee particle without it actively extracting coffee from the deep layers. Water needs to both go in and come back to carry the chemical compounds with it, and you can see the deep layers like something at the end of a maze. Water might get everywhere in the maze, but diffusion won’t efficiently carry chemicals outside the maze. It’s definitely an over-simplification and wrong when I say water can’t penetrate deeper given your experiment, I should say extraction by diffusion doesn’t reach the deeper layers. I wonder if fluid flows outside the coffee particles are responsible for accelerating diffusion near the edges of coffee particles. Also, water reaching deep in the particles gives me hope that the ratio of absorbed vs interstitial retained water doesn’t depend on grind size, which would be wonderful. This is good food for thoughts, thanks.
LikeLike
I’d like to think that perhaps some molecules do take more time to dissolve / extract even though they have access to water. For example, it might be possible that you’d be extracting almost all of the caffeine (which extracts very readily if I recall) regardless of your final extraction yield.
I’m not sure I agree with the “maze” analogy, it might look like that under the electron microscope but if you’d zoom in further you’d find the cell walls themselves have lots of little holes in them, allowing water and other molecules to pass back and forth. Are you familiar with how decaf coffee beans are processed? It’s technically possible to extract almost all the caffeine from a bean without grinding at all, though this is done on green beans not roasted beans.
I believe most of this has already been covered in literature from 50s and 60s (lead by E. E. Lockhart), I think it might be interesting to re-read the original literature.
LikeLike
Hey Can,
I think the compounds do dissolve in water, they just don’t diffuse outside the “maze”. I’m aware the coffee cells have lots of small holes, but the process of diffusion through small holes should be slow.
I’m curious, how else would you interpret the fact that Matt’s cupping bowl with the larger particles only reaches extraction yields below ~20% even after several minutes, while the bowl with the smaller particles extracts at ~24% ?
LikeLike
Yes, obviously grind size has an impact and no doubt diffusion slows things down significantly through the cell walls – otherwise grind size would have no impact. I was mostly arguing against the notion that “water doesn’t penetrate..”
Also, the following papers might be interesting reads: (can find them on sci-hub)
* Modelling the Aqueous Extraction of Soluble Substances from Ground Roasted Coffee (Zanoni, 1990)
*The Kinetics and Mechanism of Caffeine Infusion from Coffee: The Hindrance Factor in Intra-bean Diffusion (Spiro, 1988)
LikeLike
Thanks !
LikeLike
Hi Jonathan,
Nice read as always, I’m wondering if Matt’s experiment will throw the same results if the cupping bowls were continuously agitated while extracting. Agitation may get the solubles out of the bigger particles and end reaching the 24% extraction.
LikeLike
Thanks for your comment, I would expect agitation to “speed up time”, in the sense that the X-axis would be compressed.
LikeLiked by 1 person
Hi Jonathan,
Thanks for your article, it’s highly informative.
My guess about bitterness and astringency is that the overall flavor profile is crucial. Even those low-extraction-yield parts just contribute a small fraction of total extraction yield, they can definitely change our taste. Think about cooking something, if you put a little bit salt or MSG, you’ll change the taste dramatically.
There is an example about how salt suppresses bitterness. https://tierneylab.blogs.nytimes.com/2009/01/07/salt-trumps-bitter/
The hypothesis is there may be some salt-like compounds in coffee and extract very fast. Those compounds which come from deeper layers can offset a large amount of bitterness in high-extraction-yield parts. Also, there may be some astringency-offset compounds extract quickly, a little amount of those compounds can balance the overall flavor and hide the astringency.
Furthermore, the reason that we taste bitterness and astringency at higher EY may be not only because those bitter compounds extract and accumulate slower, but also because there are not enough bitterness-offset compounds to offset extra bitterness at high EY. Total amount of bitterness-offset compounds in a certain single particle is limited, so when we extract almost everything in this certain particle, we get obvious bitterness(just like those offset compounds have run out, and can’t balance extra bitterness). In order to balance those bitterness, we need to get some offset from other places, like deeper layers of other coarser particles.
LikeLike
Thanks for your comment, this is interesting. That goes back to a hypothesis that Mitch talked to me about earlier, i.e. “maybe astringency is a particular form of under extractIon”, that would fit the picture of lacking astringency-offsetting compounds. By the way, it doesn’t change much to your argument, but I’d say “slower-extracting compounds” rather than “deeper compounds”, there shouldn’t be a depth vs composition difference on average, because the coffee beans are broken randomly into very small particles, so there would be no reason to think that some compounds are more “hidden” than others in deep layers. This would be the case if we brewed beans without grinding them 😛 I think the difference really comes from the chemical properties of the compounds, maybe just its mass.
LikeLike
How could you done this?! Great job you did. thanks for sharing great experiment results and your insight.
But I still don’t fully understant this graph means,

What’s mean of beverage fraction? Please let me know about this picture. 😉
LikeLike
Hi Kim, the “beverage fraction” just tells you what mass fraction of the solubles in the beverage came from coffee cells that were extracted at each yield listed on the X-axis. For example, a large fraction or the beverage solubles came from coffee cells that were highly extracted. Hope this helps.
LikeLike
Ah I fully got it. Thanks a lot. One more question, in this model, how you measured mass fraction of fines and wetting depth? Is it derivided from computational model?
LikeLike
Yes those are free parameters of the model; they are adjusted so that the model fits the Barista Hustle data. So the values that I give are those that best reproduce the data.
LikeLike
Fascinating reading ! (And I really love your description of the Monte Carlo method… hard to get the image of yelling monkeys out of my head now :D) … I was also shocked by the huge mass and almost constant value of it for the fines. I think, even though you called them fines what that values probably represent is anything that is being extracted fully and instantly when contacted with water – may it be that the (supposedly very rough) surface of a coffee particle fits that description? Then the actuall fines would be particles that after this “surface” extraction dont have anything else to offer for extraction? Anyway … its not only how much mass in your model is in the fines, but also that its almost exactly 50% that is really making me uncomfortable … Looking forward to more testing of your model … as its really inspiring.
LikeLike
Yes, same reaction here. I think a large part may be in part fines sticking to regular particles or very rough surfaces (there was another comment here about this)
LikeLike
Hi Jonathan,
Thank you for the interesting post and that it has stimulated an equally interesting discussion 🙂
Indeed, a component with a strong taste “contribution” might have a small contribution to the overall mass. Instead of EY data vs time it might require a spectrometer to analyse the fraction of different components vs time. The fact that some components can “offset” the taste of another component makes the task even more difficult (i.e. was it the “salt and pepper” which were added last, or the “salt offsetting component” which was added last).
LikeLike
Oh most definitely; Similar EYs will only taste similar with the same bean, roast, brew method and brew water. Even different grind sizes at the same EY should taste a bit different in my opinion. I’d love to get my hands on a mass spectrometer, this is one of the reasons why I’ve set up a Patreon 😛 I’m sure there would he kickass things that could be done with one.
LikeLike
Great article, I really enjoyed the work you’ve done!
About the bitterness/adstringency thing, could it be related to the water mineral and chemical properties? As if the water could buffer or counteract these bad tastes up to a turning point, when it becomes evident in the taste. This is the same reasoning of the water alcalinity preventing changes in pH, but when all the carbonate ions are consumed the pH changes
LikeLike
Thanks ! It’s possible water properties could interact with polyphenols or even with our ability to taste them, but I don’t know. There’s a lot of blind tasting water experiments needed !
LikeLike