
I recently read James Hoffman’s fantastic book The World Atlas of Coffee and followed the also fantastic new Terroir course at the Barista Hustle web site. All of this reading motivated me to think a bit more about coffee varietals when I’m enjoying a cup of coffee. Previously, I had noticed some obvious taste differences between varietals, like the fact that typical Kenyans such as the SL28 varietal tend to have a nice taste of blackberries (or tomato when the roast is underdeveloped) but I did not think about it much further.
His book also made me realize that I couldn’t find much information about the typical taste profiles of different coffee varietals or processing methods, other than anecdotic facts and tasting notes of individual roast batches. Clearly, there is a ton of subjective tasting notes available out there, and I thought if we could only collate a big pile of them, I could probably distill it and see if some interesting trends come out of that.
I decided to contact Alex, a friend who built a really cool mobile application (for iOS and Android) called Firstbloom, where they actually did just that. They allow users to build their own personal library of various roaster’s bags and consult other people’s ratings. One really nice thing about it is that unavailable past offerings don’t disappear (some day, someone will need to explain to me why roasters always completely delete web pages of their past offerings, rather than just unlink them). Anyway, Alex was super happy to help me with this idea, and he generously sent me his metadata on 1,500 coffee bags with varietals, tasting notes and processing for every one of them ! Alex and his team built Firstbloom as a passion project (much like my blog), and I’m highly appreciative of their work and precious help with this idea. So, in a way, today’s blog post was sponsored by Firstbloom’s incredible efforts at collating these data, otherwise it would not have been possible.
Taste Descriptors by Coffee Varietal
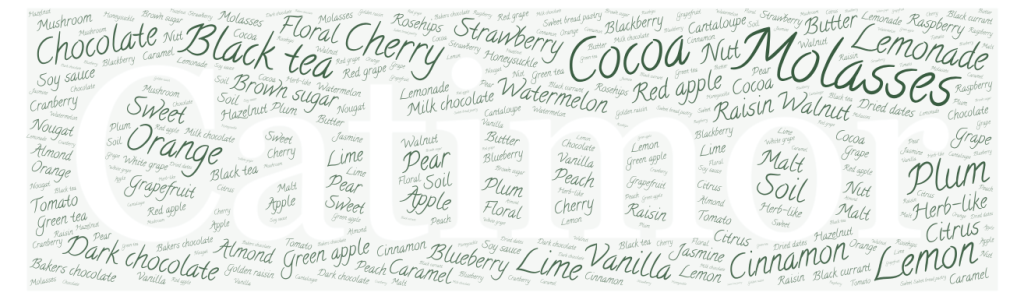
The first thing I decided to investigate is the taste descriptors that come up most often for each coffee varietal. For this I only used coffee processed with the washing method, because it is the most abundant and I also think it is the process that will bring up varietal characteristics most clearly without influencing them (don’t tell Scott Rao, but there are some naturals that I love even if I think they distort the tasting profile). A very neat tool to visualize such data is a word cloud; each word is displayed with a size representative of how often it came up in a list. There are some Python packages that do basic word clouds, but I found out this website that offers way more options. Coding that from scratch seemed like an annoying enterprise, so I decided to just use it.
I did not just collate all of the taste descriptors and count the number of repetitions when I assigned weights to each word, the way one would typically build a word cloud. This would be an ok way to do things, but it would not necessarily amplify the differences from one varietal to the other. As you can see in that figure, there are some words that come up way more often than others when describing any kind of coffee:
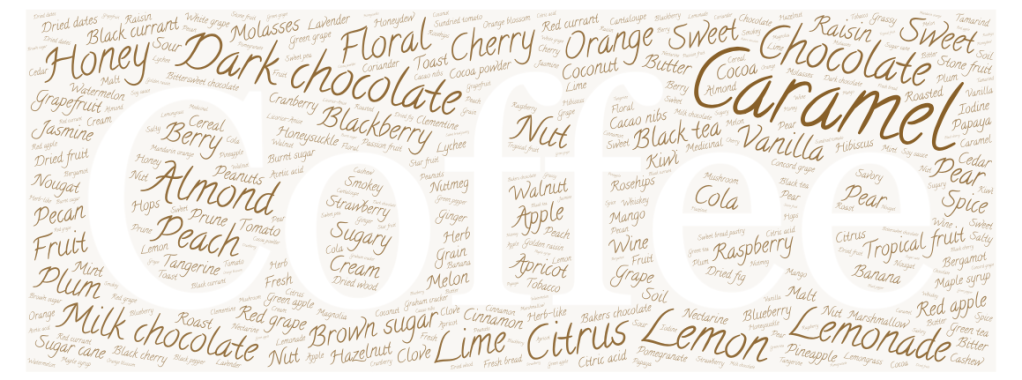
These descriptors are not the most interesting to me, as they are the ones that come up most often regardless of varietal. What I would rather want to see are the specific descriptors that come out in one varietal more than in others. To do this, I counted the number of times a descriptor happened within a varietal, and normalize that to the amount of times it happened in any coffee, hence the descriptors in larger fonts above will be somewhat muted. In other words, if a taste descriptor happens a lot for SL28 and not that much for other varietals, it will be amplified more than a descriptor that happens a lot for SL28 as well as any other coffee. There is one potential drawback of doing this: Imagine there is just one bag of coffee ever that had the taste descriptor carrot. It would end up being extremely amplified in the word cloud of the one varietal where it happened, because it was never used for any other coffee. To mitigate that effect, I put a “ceiling” on the level of amplification that rare words can obtain; I decided that no word could be amplified by a factor larger than 3.3 because of its rare use in other coffee varietals.
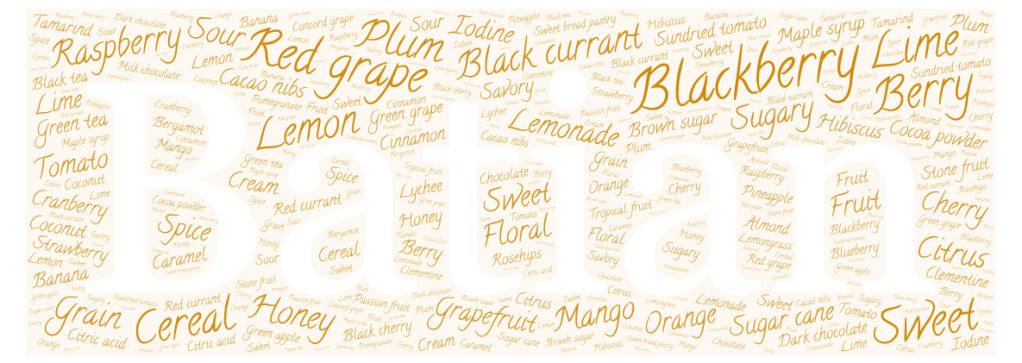
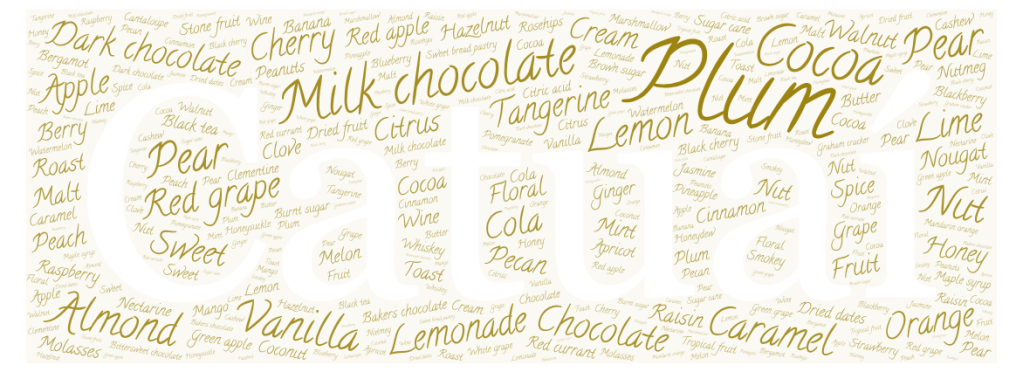
Now, the fun part ! Here are some collections of taste descriptors for some of the most widespread coffee varietals:
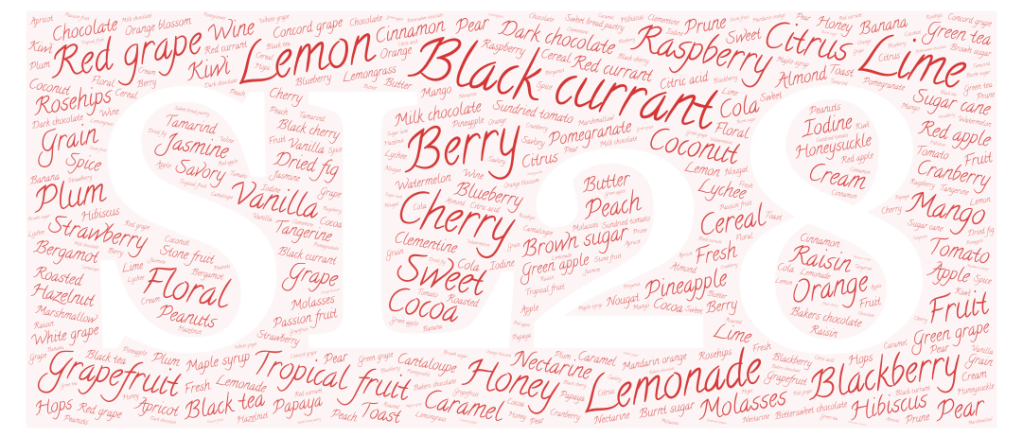
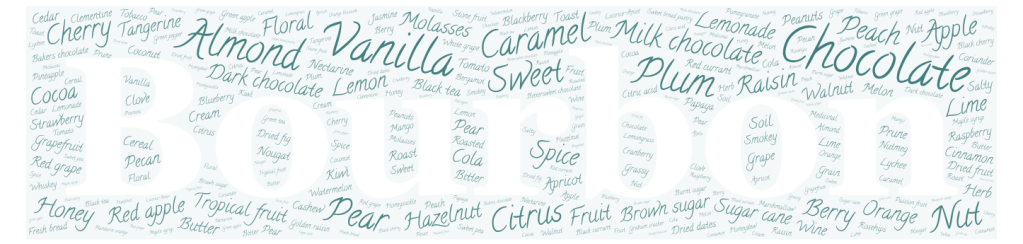
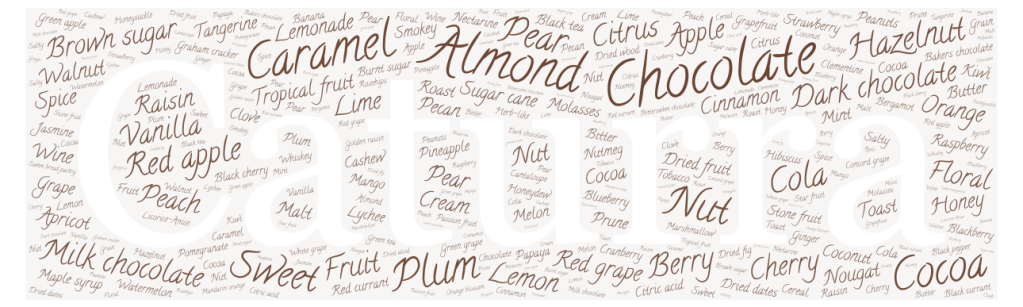
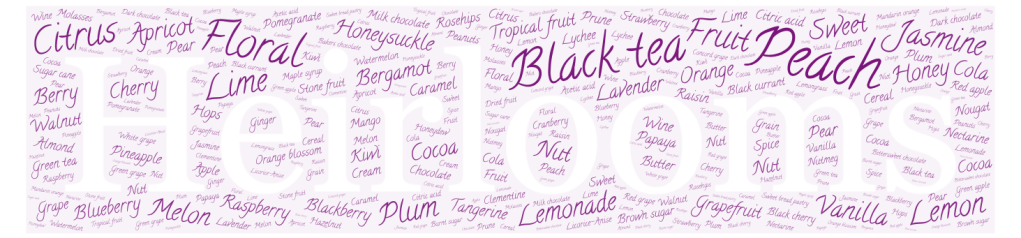
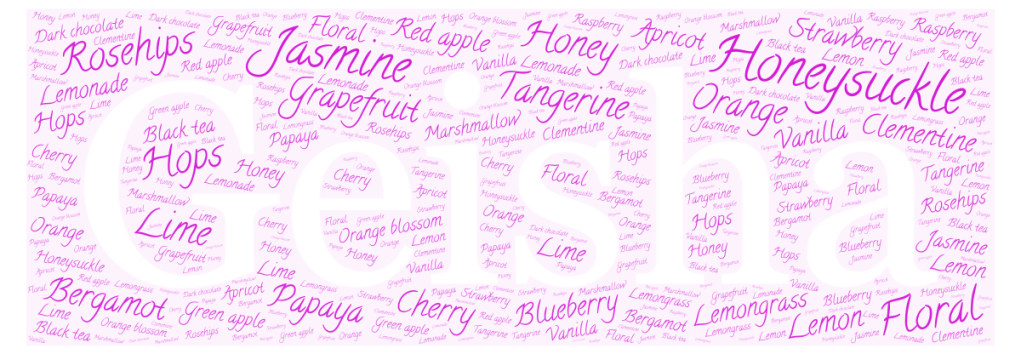
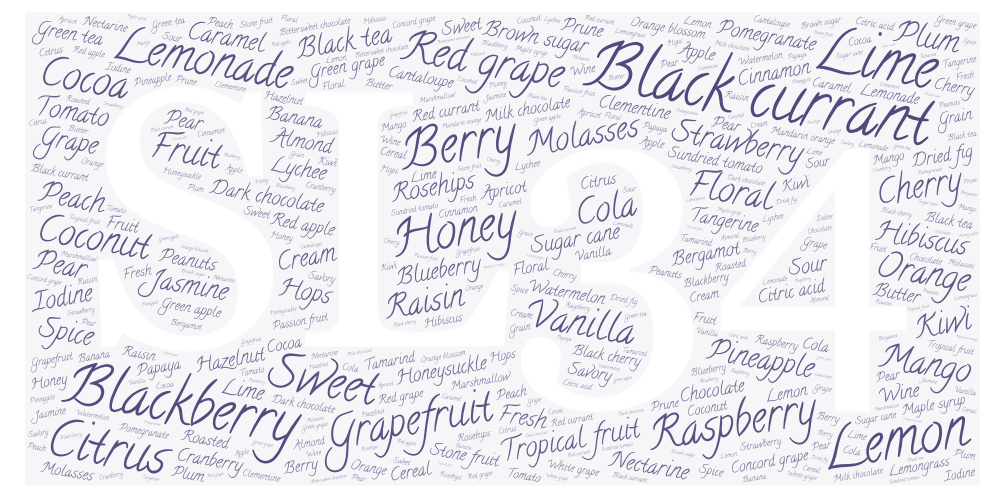
This already jumped out as very representative of my experience. Ethiopian heirloom coffees often taste very floral and have a distinct citrus-like character often described as lime (see this great book review by James Hoffman where he talks a bit more about “heirlooms”). As I expected, SL28 is largely dominated by descriptors like blackberries or black currant. Just writing this makes me want to brew a good Kenyan cup. The Geisha varietal seems dominated by floral and fruity descriptives, my personal favorites (I’m so original). One thing that surprised me a bit more is how Caturra and Bourbon come out quite similar. But this is not actually that surprising, because Caturra arose from a naturally occurring mutation of the Bourbon varietal (as described at World Coffee Research).
There are some significant caveats I should add to these results. First, there are some taste descriptors that are caused by roasting more than varietal. I suspect that some varietals like Caturra are a bit harder to roast properly, and to diagnose once they are roasted compared to most Kenyan and Ethiopian coffees. If I’m right about this, then there will be some part of the unique characters of Caturra above that might be caused by a less optimal average roasting, and not by genes. For example, I suspect that some nutty descriptors might be part of that category.
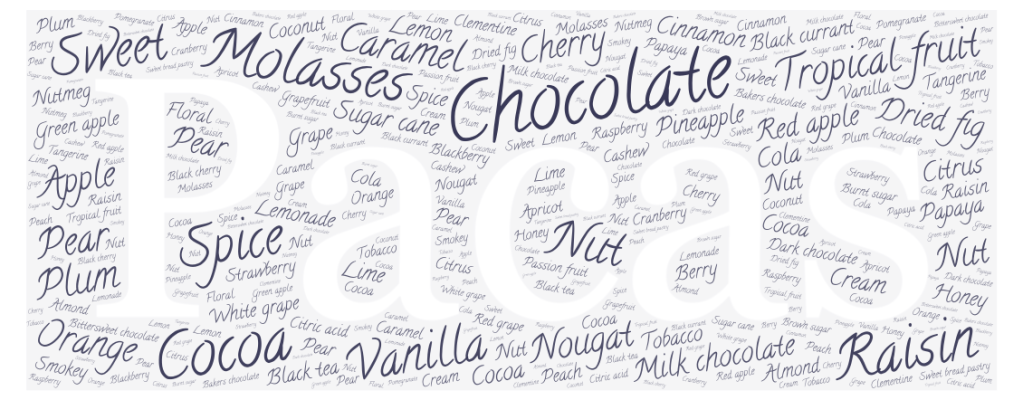
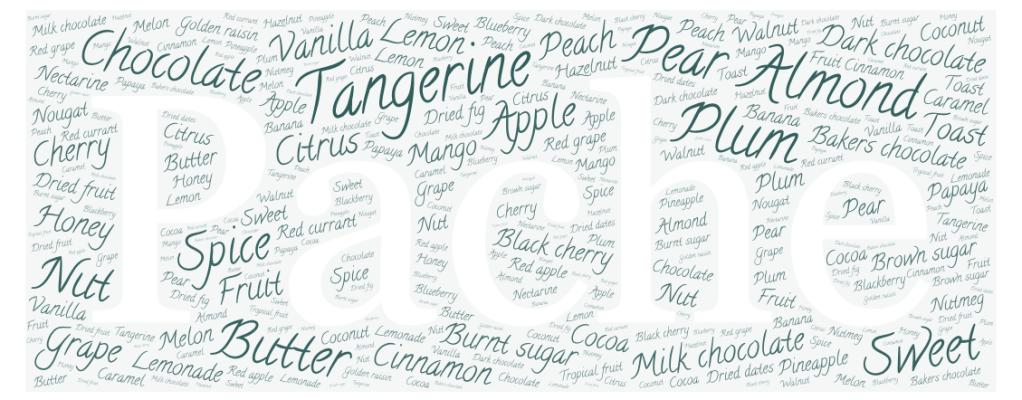
Another likely bias comes from terroir, which might have a strong effect on taste; by terroir, I refer to the type of soil, weather, shade and other aspects of how farmers take care of their crops. Add this to the fact that some countries like Kenya often grow a very selective list of varietals (e.g. SL28, SL34, Batian and Ruiru 11), you will end up with a strong varietal versus terroir correlation. This means that some of the taste descriptors coming up in SL28 above could have more to do with terroir than actual coffee genes. In order to tell them apart, we would need a lot more data on typical Kenyan crops grown outside of Kenya. If we look at the word clouds of these four particular species next to one another, it might make you worry even more about this strong correlation:
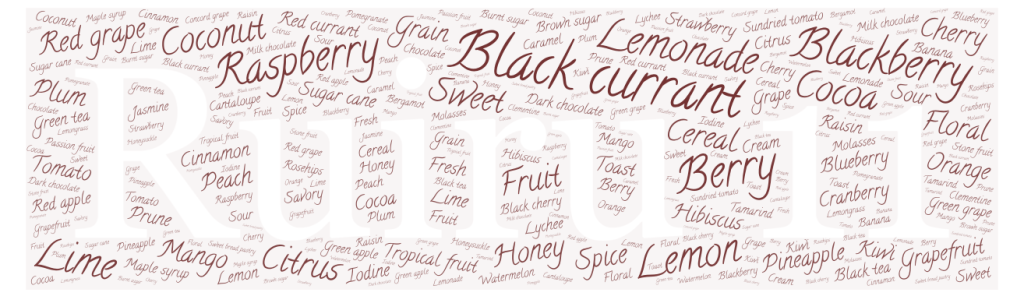
These four varietals are also sometimes grown, roasted and sold as a blend , so the taste descriptors for the three species will also tend to be somewhat mixed together, even in the unlikely scenario where there was no effect from terroir.
Although these word clouds are biased by terroir and roasting, they are still super useful to me, because the bags of coffee that I’m gonna drink are also affected by the same biases. From a user perspective, it’s therefore really fun to know which varietals will typically get you in what kind of taste territories. I would however bet that in 10 years, a typical user experience might shift far from the word clouds above.
But even this more limited use of the word clouds above is not perfect, because there’s yet another effect that clearly taints these word clouds, and will make them a little bit less reliable as a guide to which coffee you want to buy: human bias. I found that roasters will very rarely write tomato on their bag of Kenyan coffee, even when it tastes like nothing else but tomato soup. This is not surprising, because tomato it is widely known as a roast defect form under-developed Kenyan coffee, so it would be a bit of a bad self publicity to write that on a bag of coffee. Therefore, there are some “surprise” taste descriptors that won’t end up in the word clouds above, but may end up in your cup of coffee !
Taste Descriptors by Coffee Processing
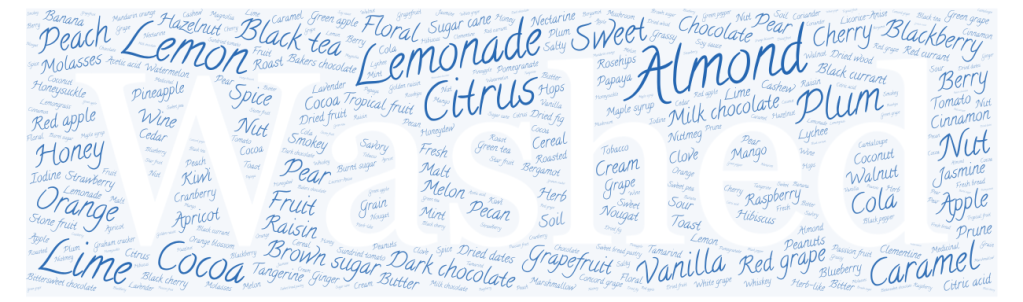
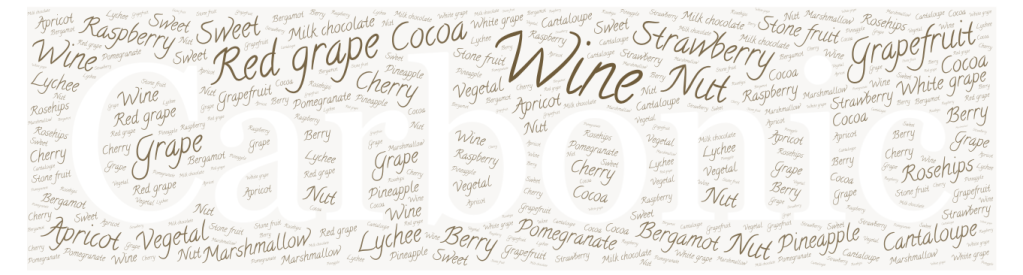
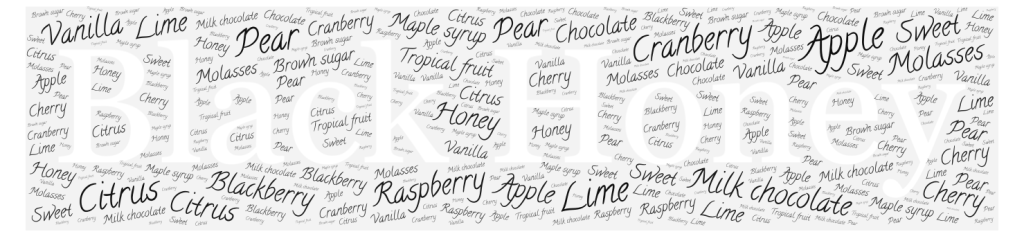
Another aspect that is widely known to affect the taste profile of a cup of coffee is the process by which the pulp is removed and the coffee beans are dried, generally referred to with the umbrella term processing. So, I decided to make similar charts, but this time grouping bags by processing rather than varietal. This is what came up for the two most dominant processing methods, washed versus natural:
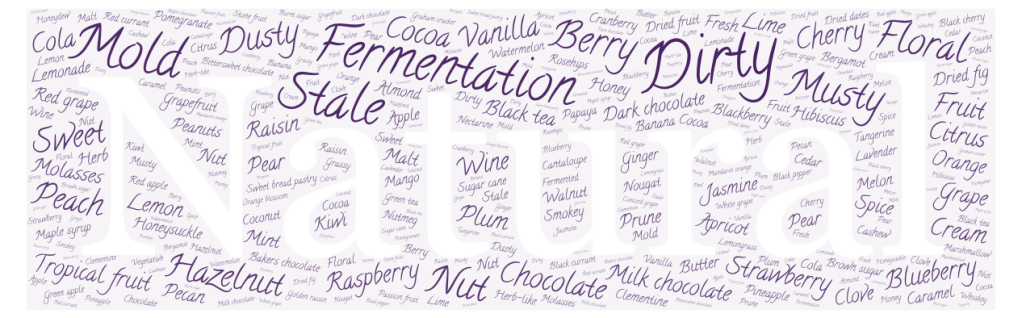
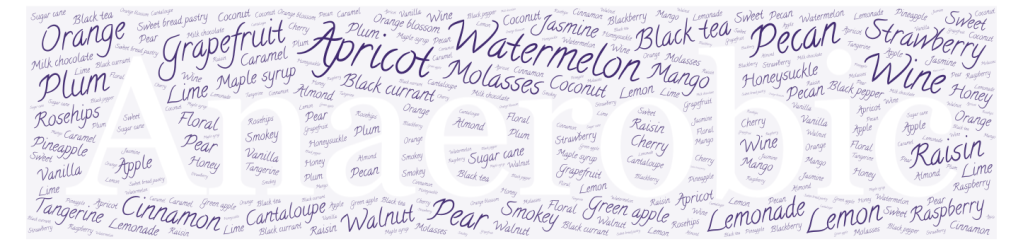
Hahaha, that was just a joke ! Here’s what really came up from the actual data on natural-processed coffees:
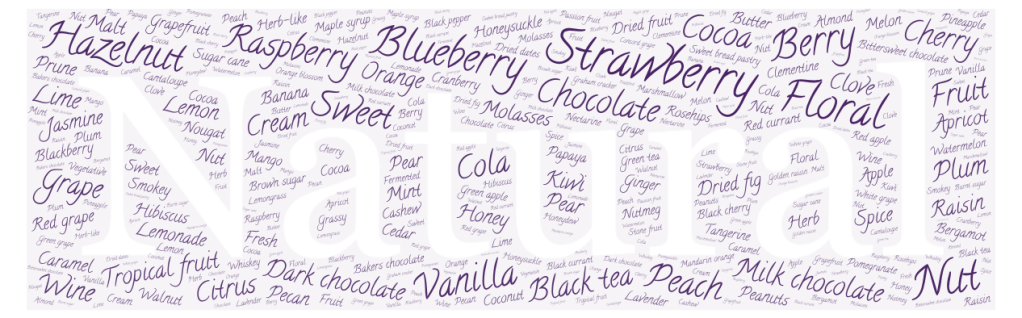
I may be joking about it, but there are a lot of naturals that don’t actually taste dirty at all. I enjoy these “clean” naturals much more than the other ones, but that’s just my preference. For example, all natural coffees I ordered from Gardelli yet were very clean, and I loved them.
The same limitations that I mentioned above still apply here, plus a new one: some varietals tend to never be natural-processed (e.g. the typical Kenyan varietals) or vice-versa, and that will introduce some correlation between varietal and processing, further biasing the two word clouds above. I remember reading that the way “washed” coffees are processed in Kenya versus Colombia is also very different, so that’s yet another bias !
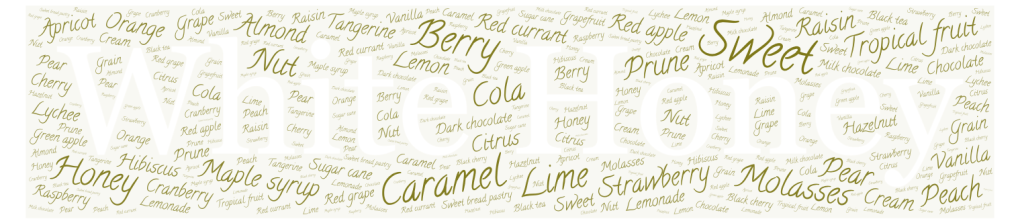
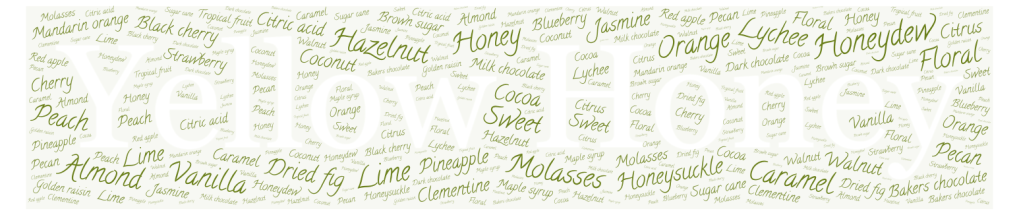
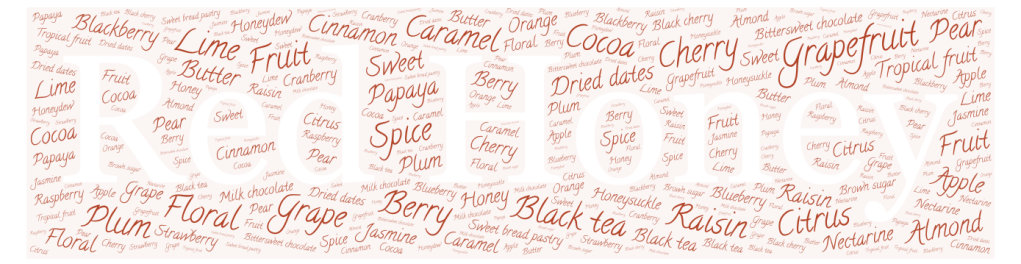
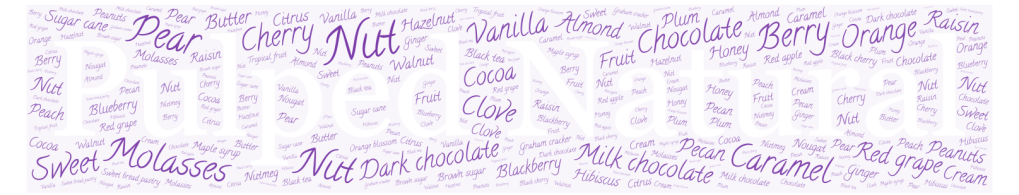
Speaking of human biases, here’s a really funny observation:
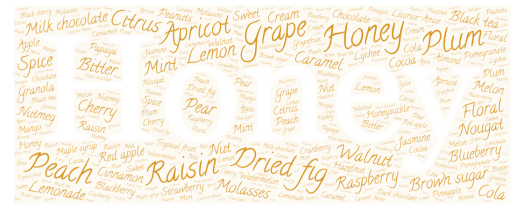
One of the top descriptors of honey-processed coffee is honey… hmmmm suuure, I’m very skeptical that this is not just tasters influenced by the actual process name. I would bet a full dollar that other descriptives in the sweet category might replace it if we did this blindly.
While I showed you the word clouds for the main categories, I generated a lot more of them. I will all gather them at the end of this post so that it doesn’t get too cluttered with figures !
The Flavor Wheel
So, that was super interesting to me, but there are more fun things we can do. For example, a few groups have defined flavor wheels for visualizing coffee flavors; those of the Specialty Coffee Association (SCA) and Counter Culture are probably the most well-known, but I thought there would be a way to arrange categories and the wheel itself in a way that would be more intuitive to me; here’s how I defined the first- and second-level categories.
I decided to split the wheel in two parts, where all the flavors generally seen as positive are on the top half, and those generally seen as less desirable effects of roast or green coffee are placed on the bottom half. And while we’re talking about halves, why not make it look like a coffee bean ? I used an elliptical coordinate system to make it look a bit more like a coffee bean. Once you get familiar with these figures, they can tell you a lot about the coffee just from a quick glance, and I love that. Here are the ones I generated for the main varietals; there are similar figures for 30 varietals and 14 coffee processing methods (with high-resolution vectorial PDF versions) which I made available to my Patreon supporters (Bourbon-tier and up):
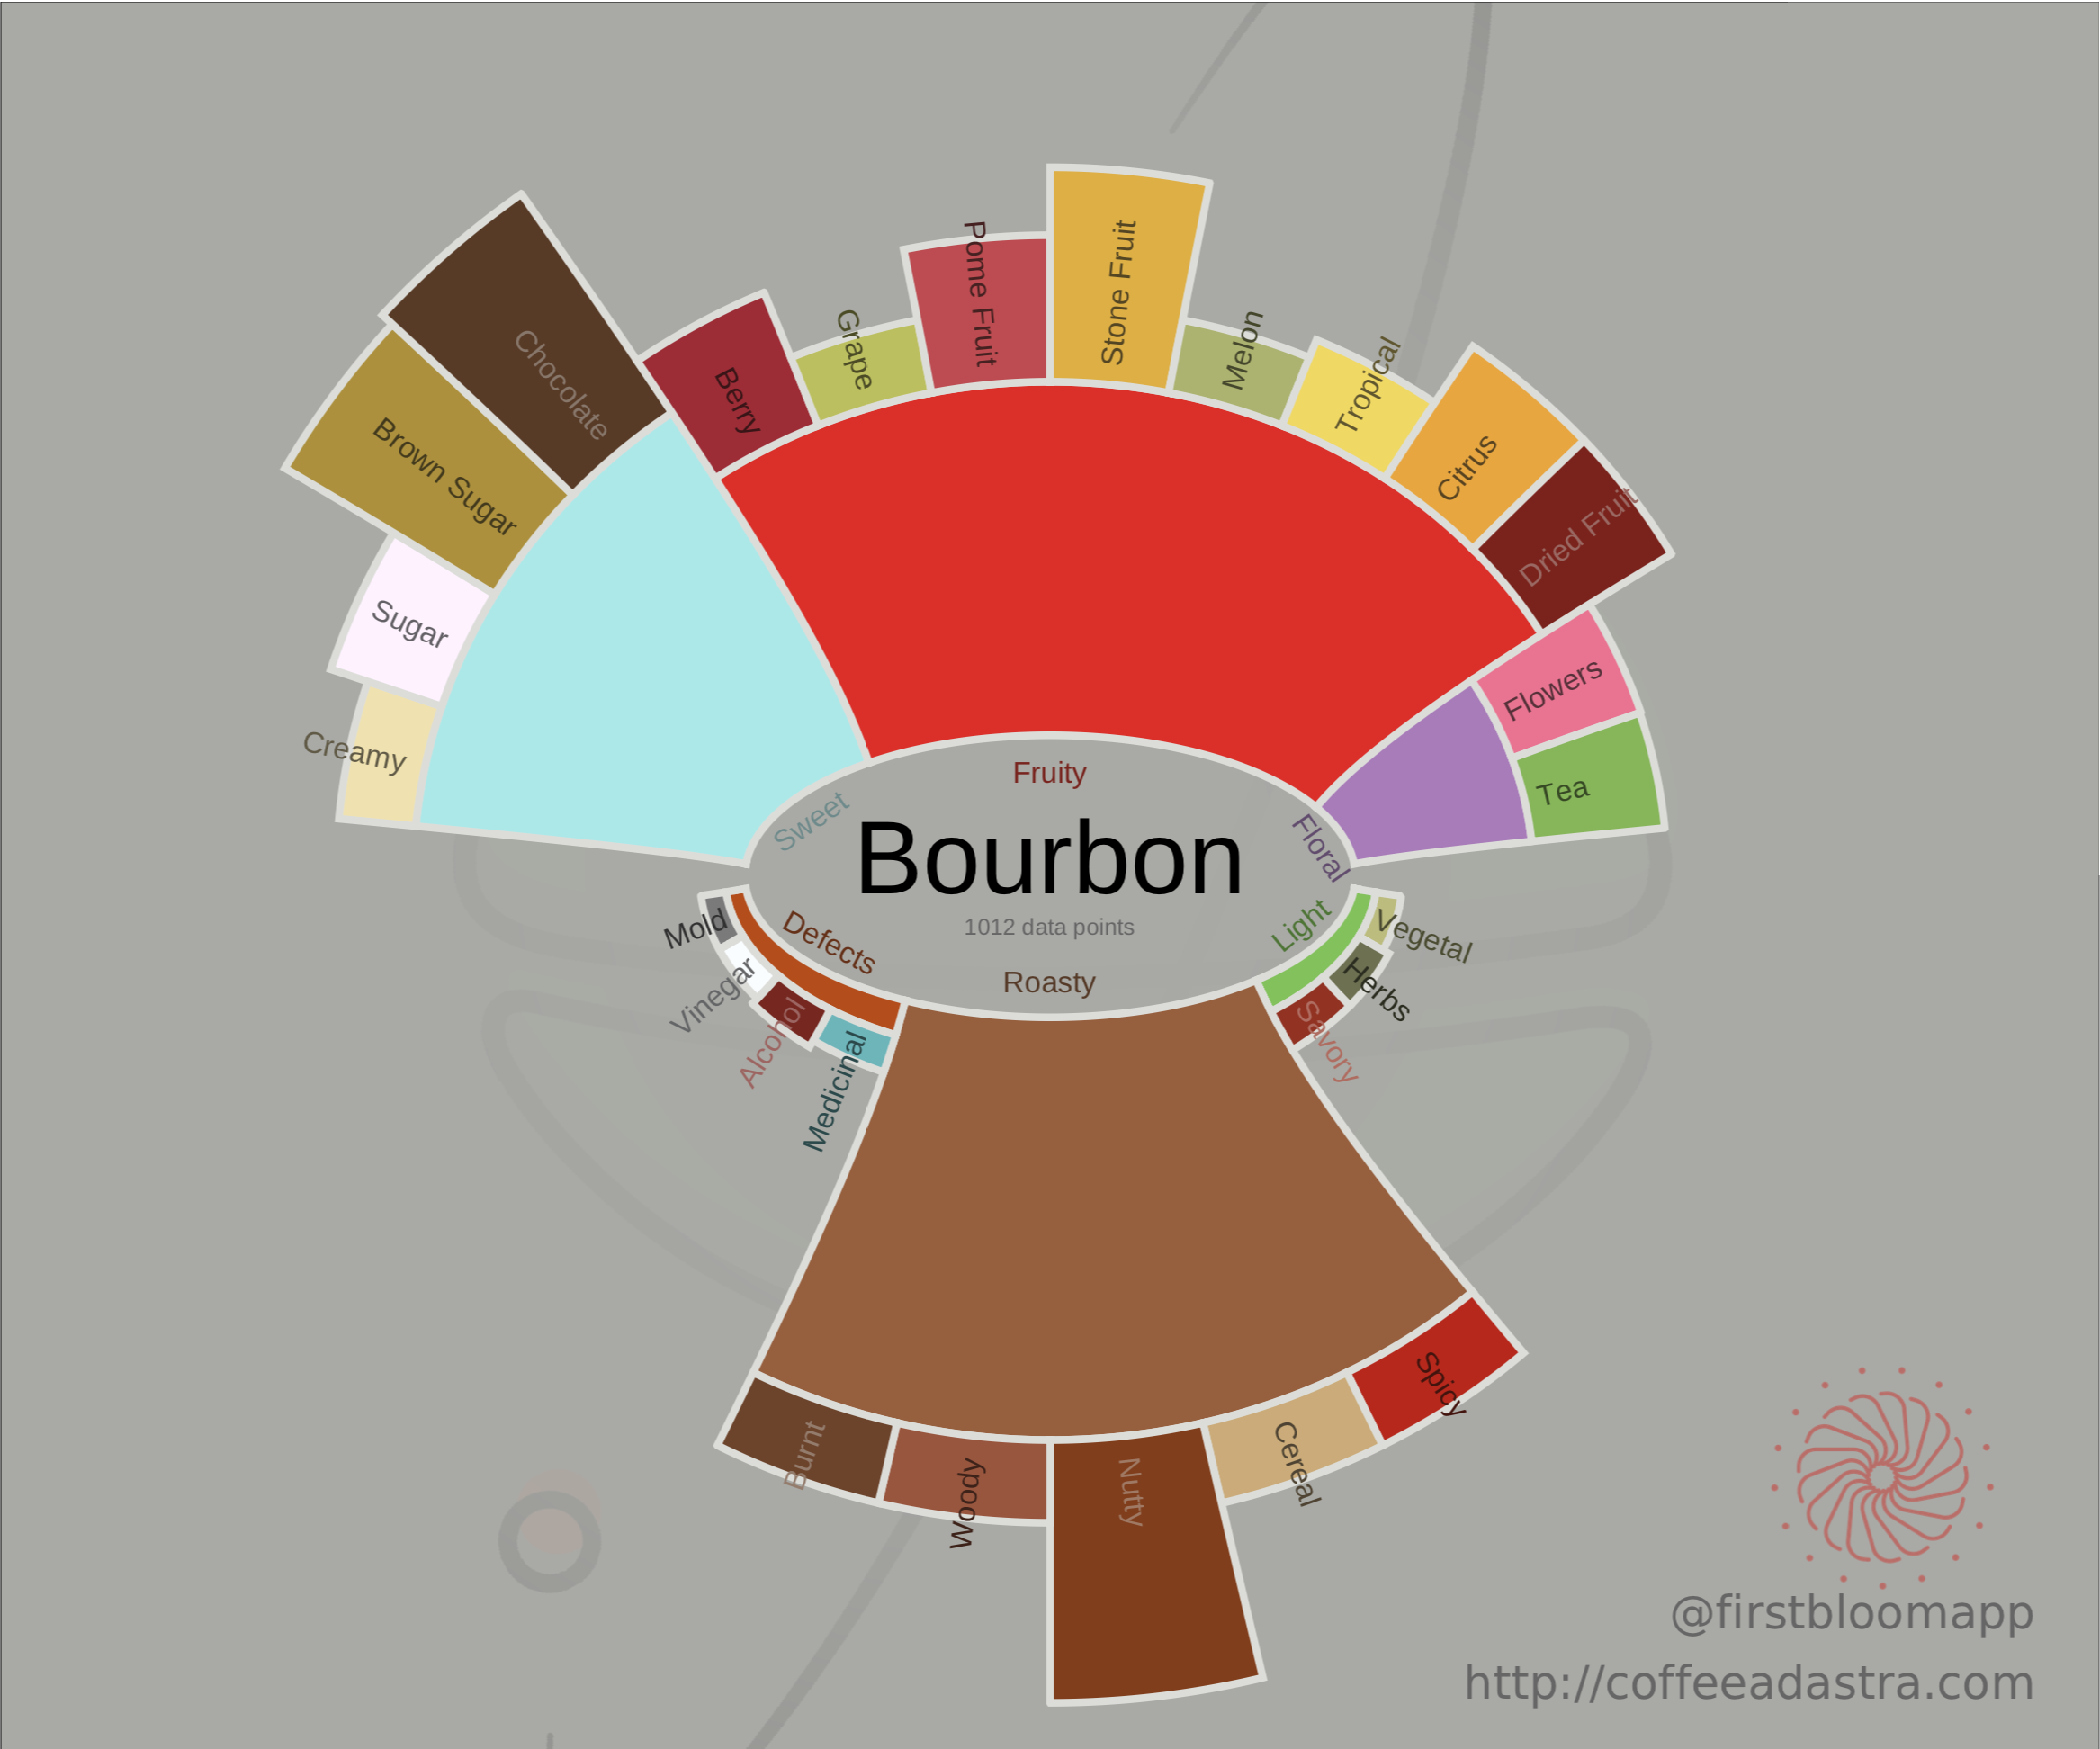
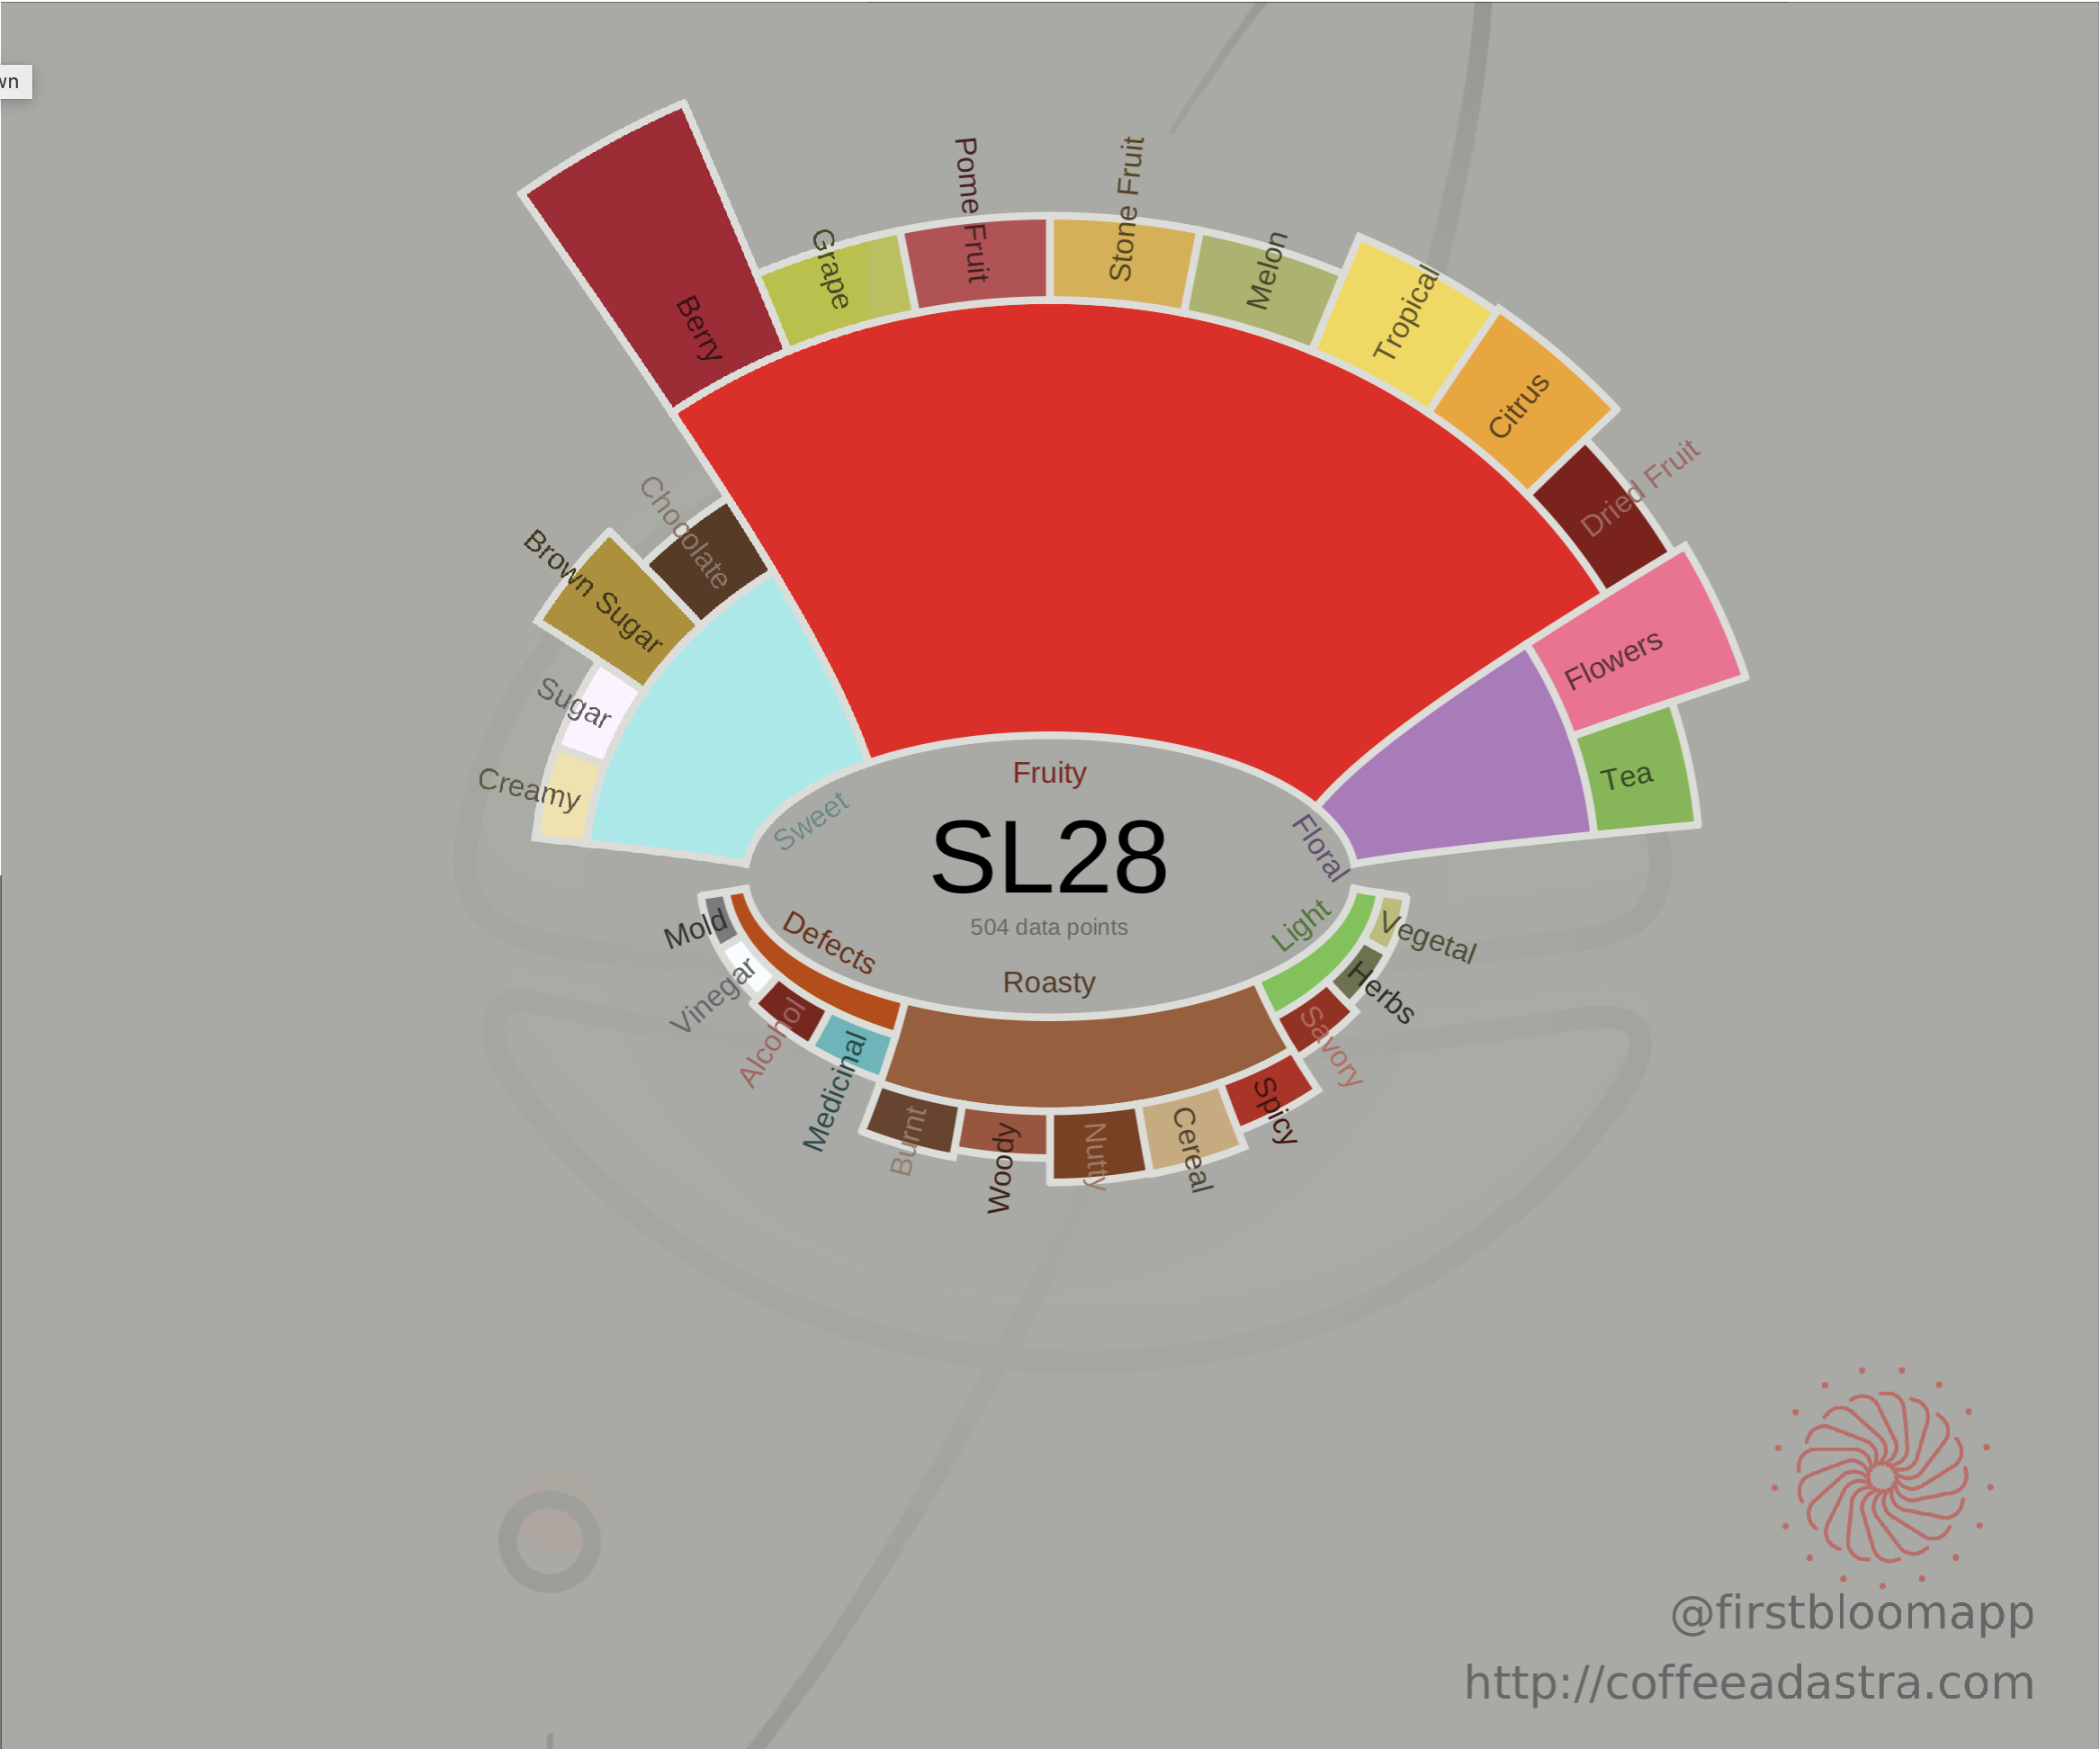
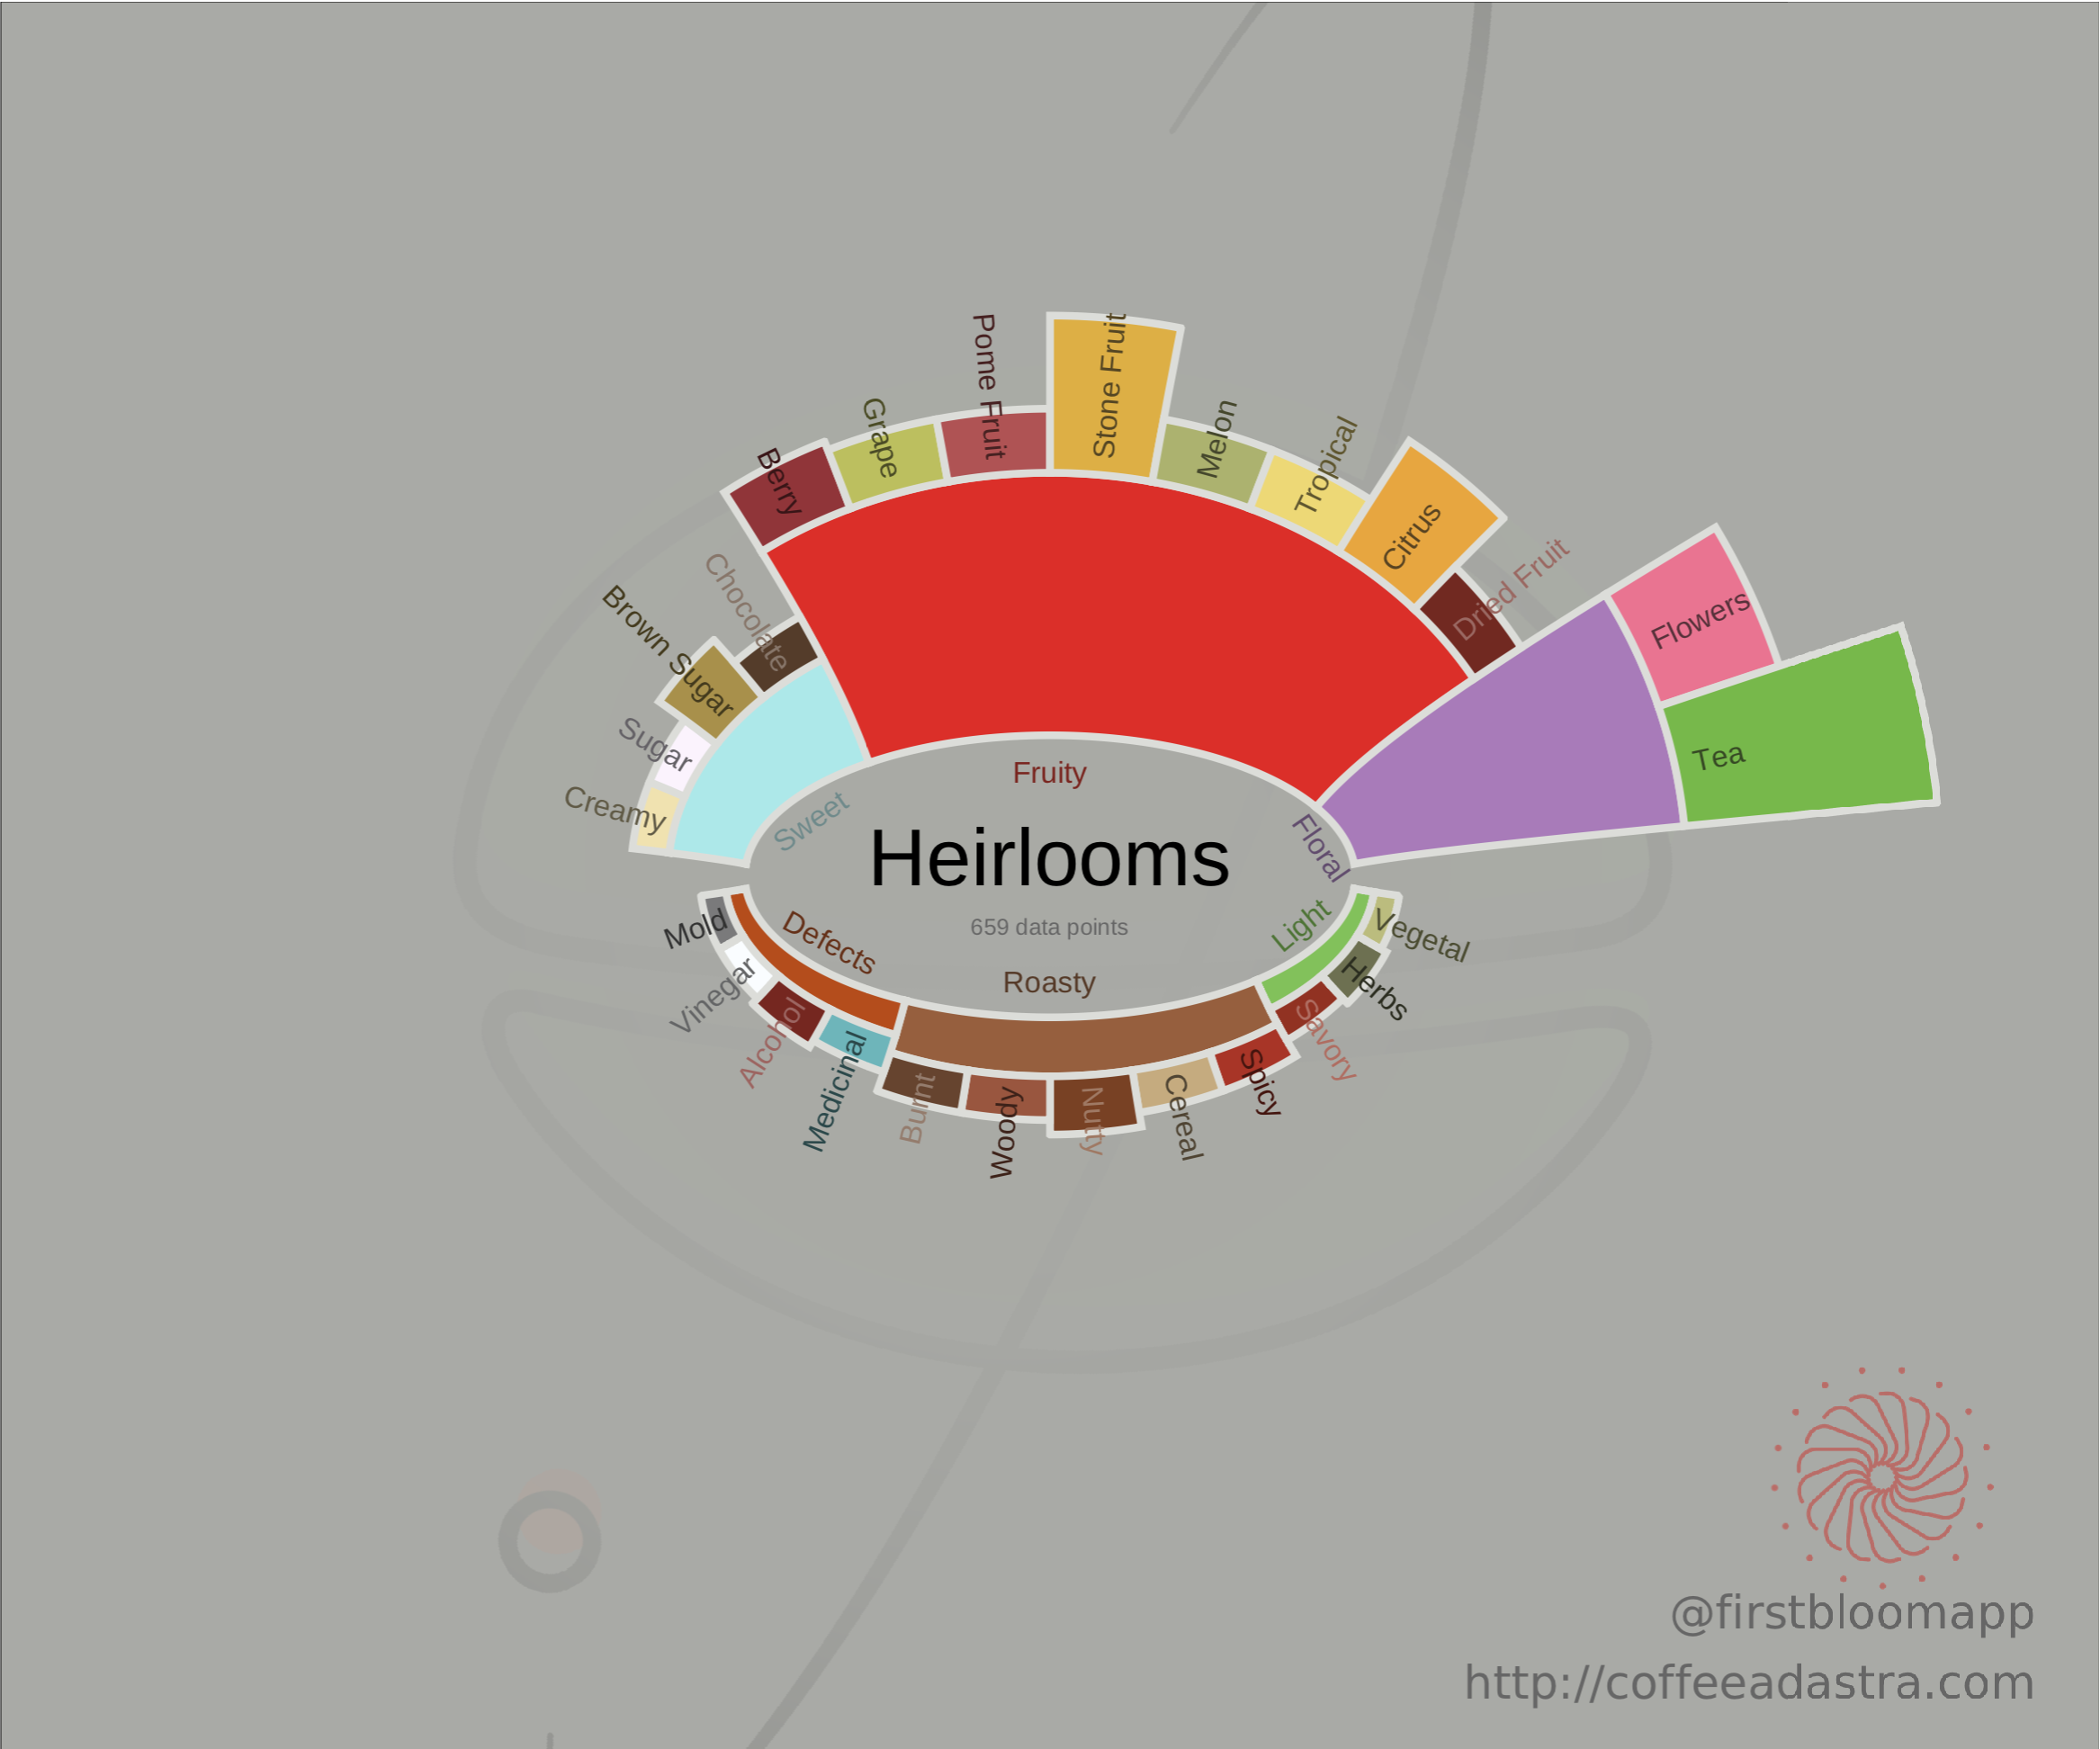
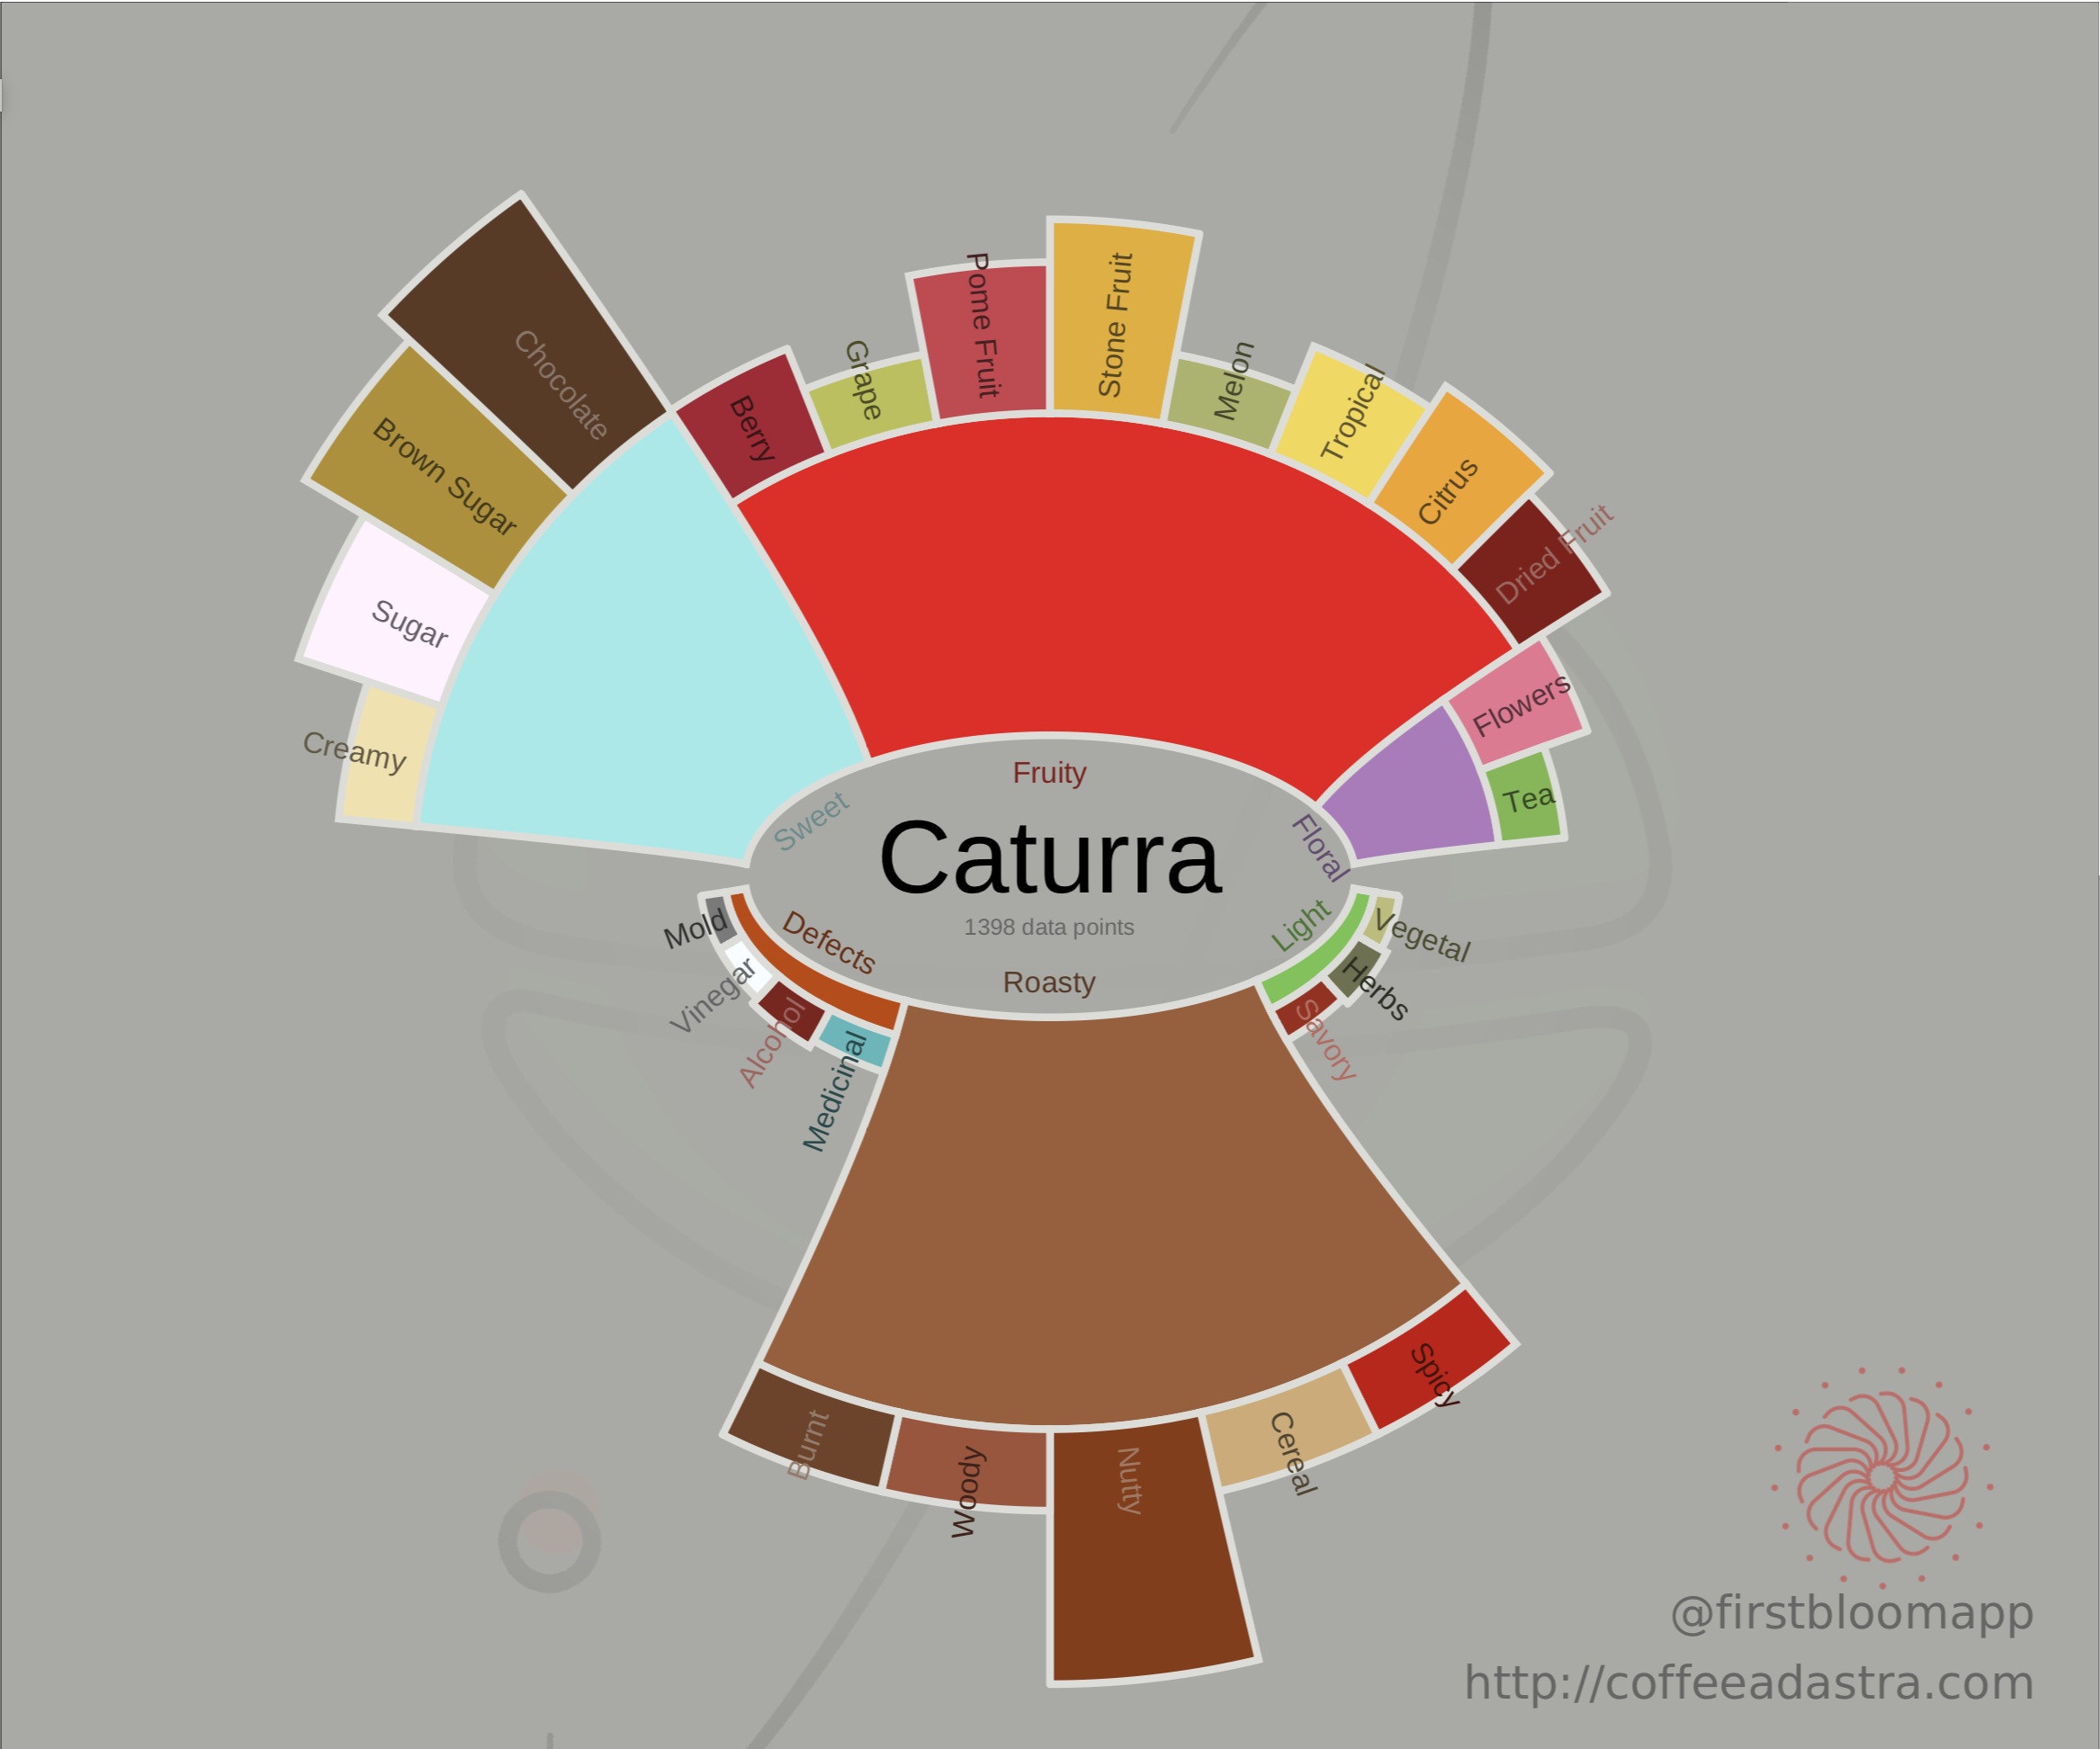
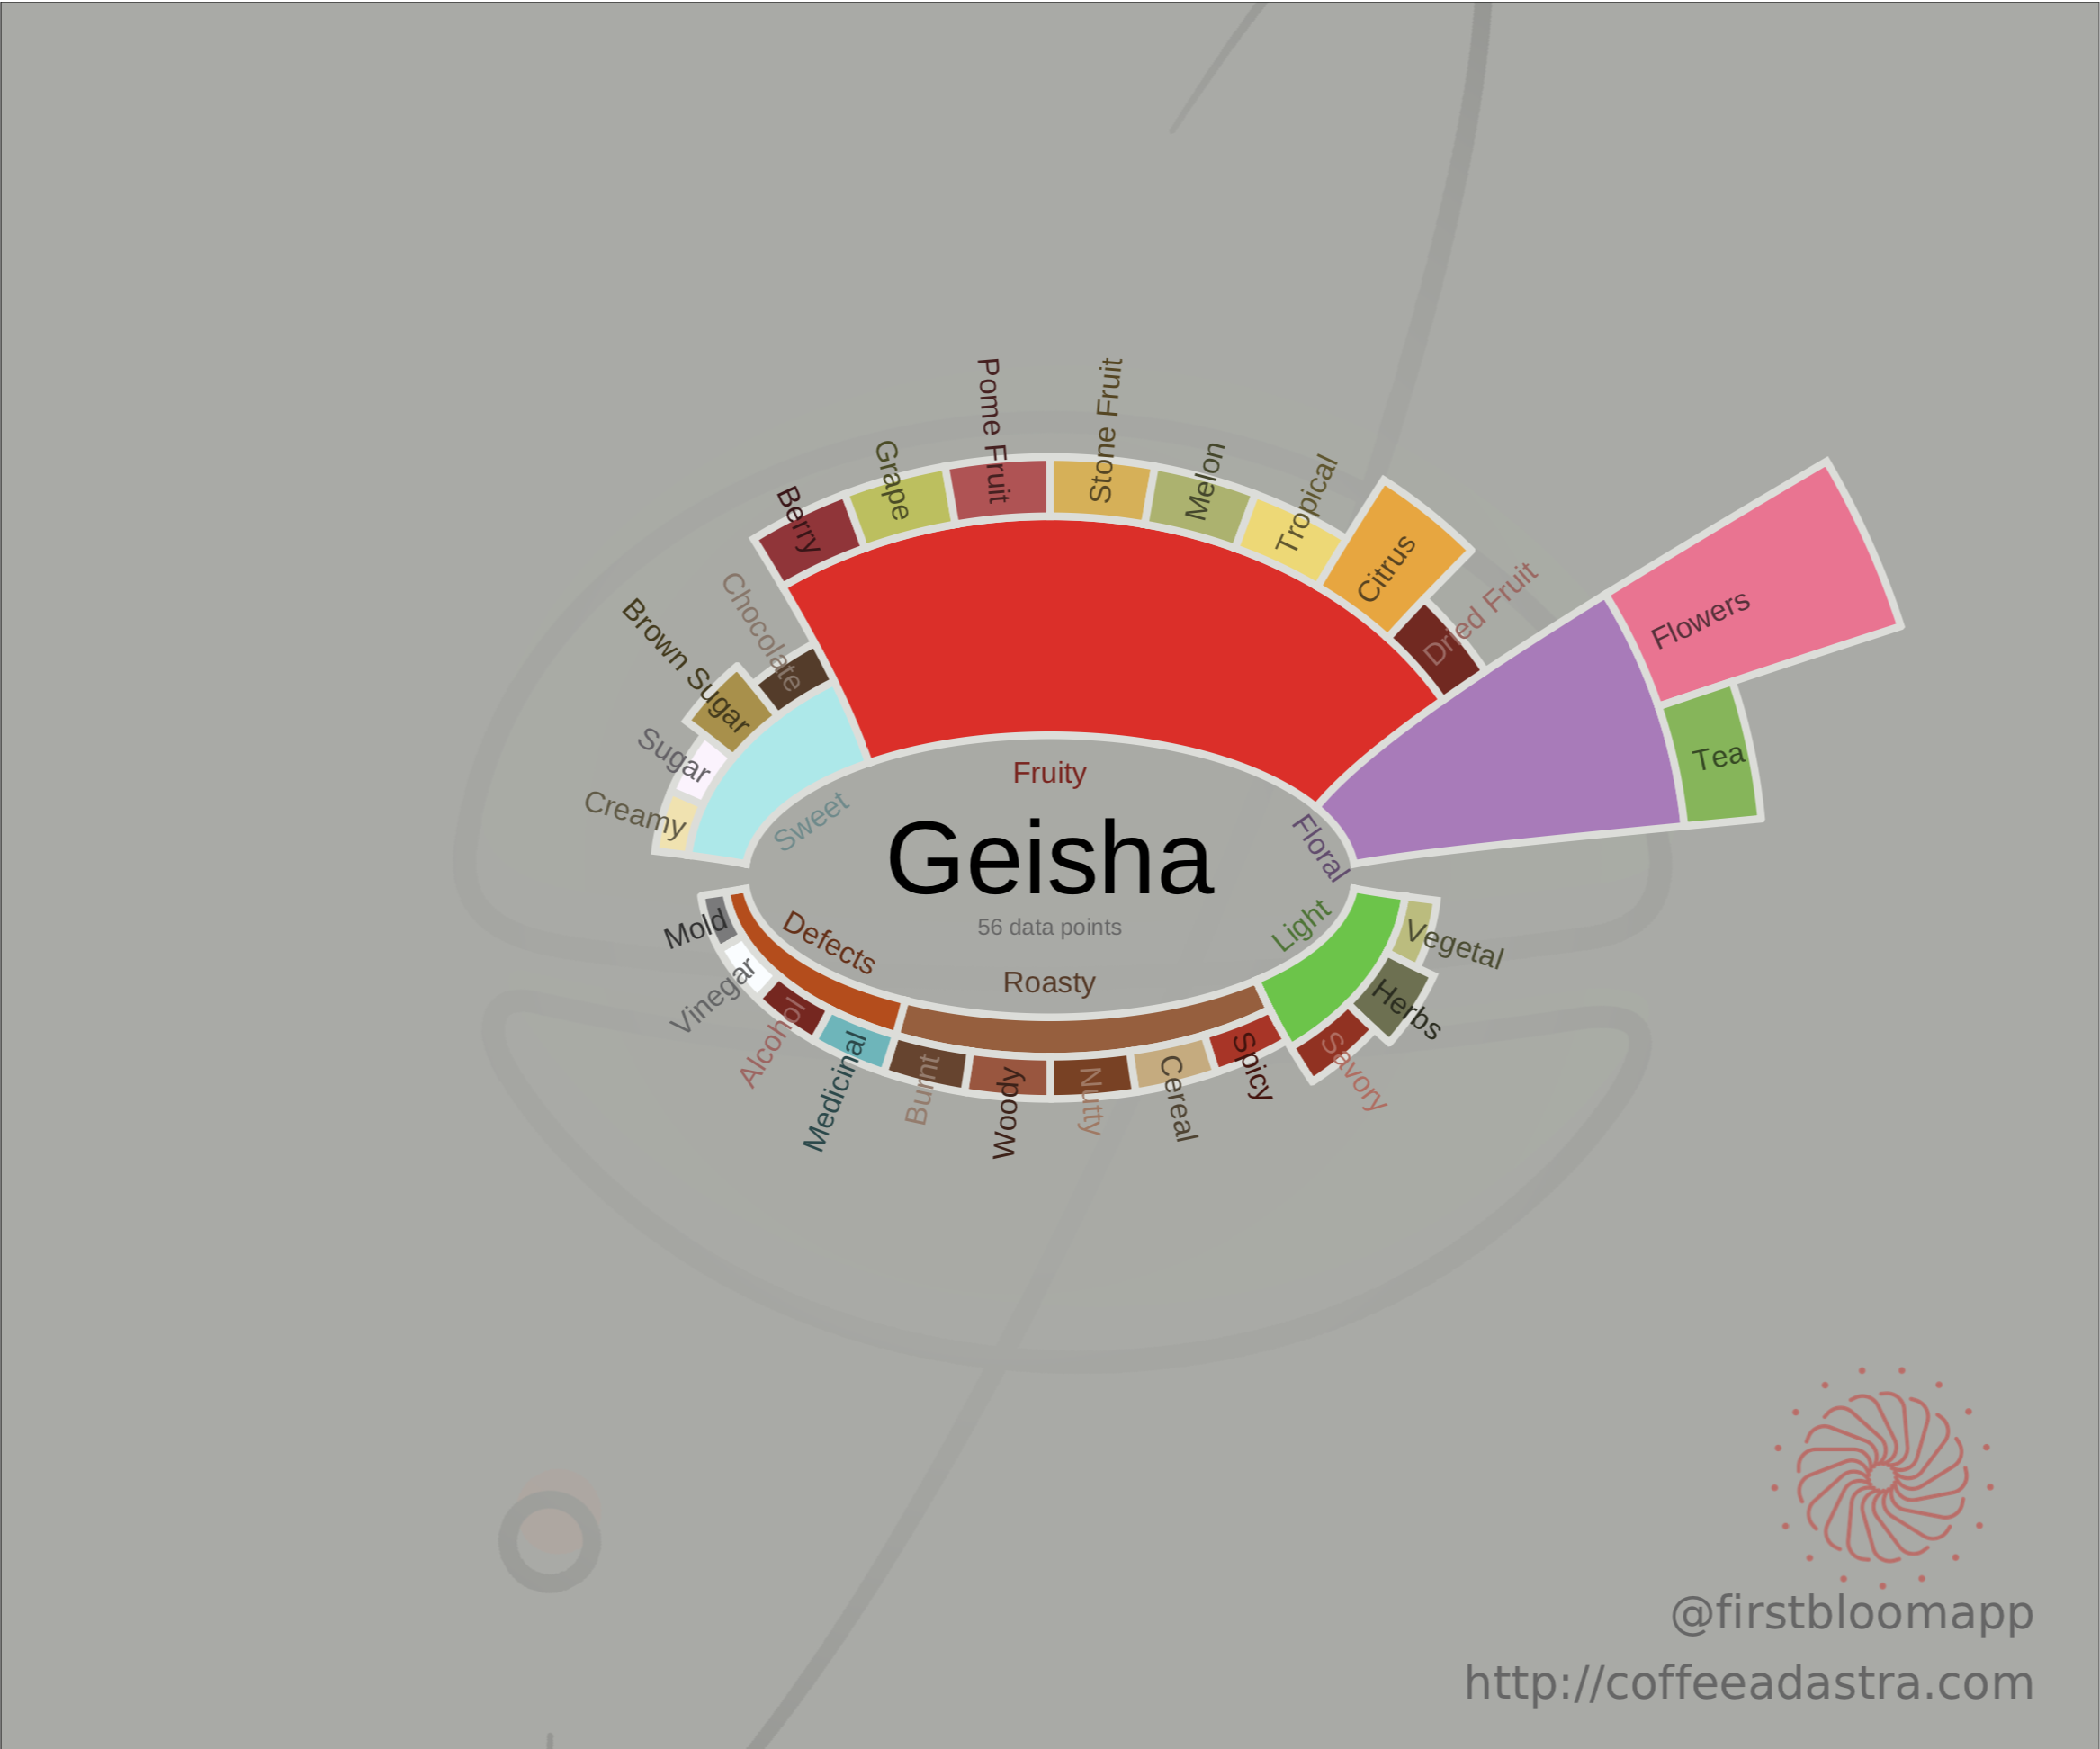
As you can see, Geisha is the king of floral attributes ! It’s also interesting how Bourbon and Caturra often have nutty flavors typically associated with roasting. It makes me wonder whether it’s harder to make great roasts out of them, but I don’t know enough about roasting.
Ranking Specific Flavors
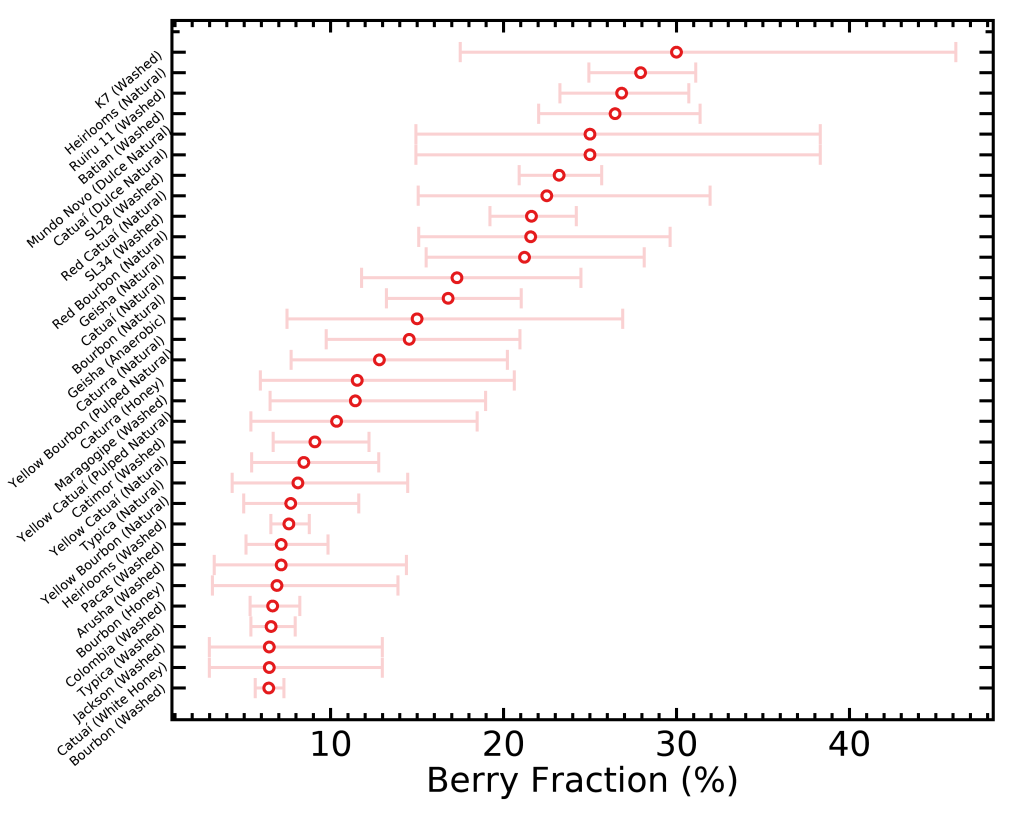
There is yet another way of visualizing these data that would be interesting; that one is an idea from Scott Rao. I selected a few taste descriptors that are often sought for by coffee drinkers, and ranked the different varietals and processes by how often they come up in their respective categories. This time I didn’t normalize the fractions by how often they come up in all coffees, because it won’t affect the order of rankings. I did however add error bars (for the math geeks, Poisson errors) to represent the small-number statistics; in other words, when a given varietal/process is represented with less bags, the true fraction of how often it’s described with one word will be more uncertain because we don’t have enough data to constrain it well.
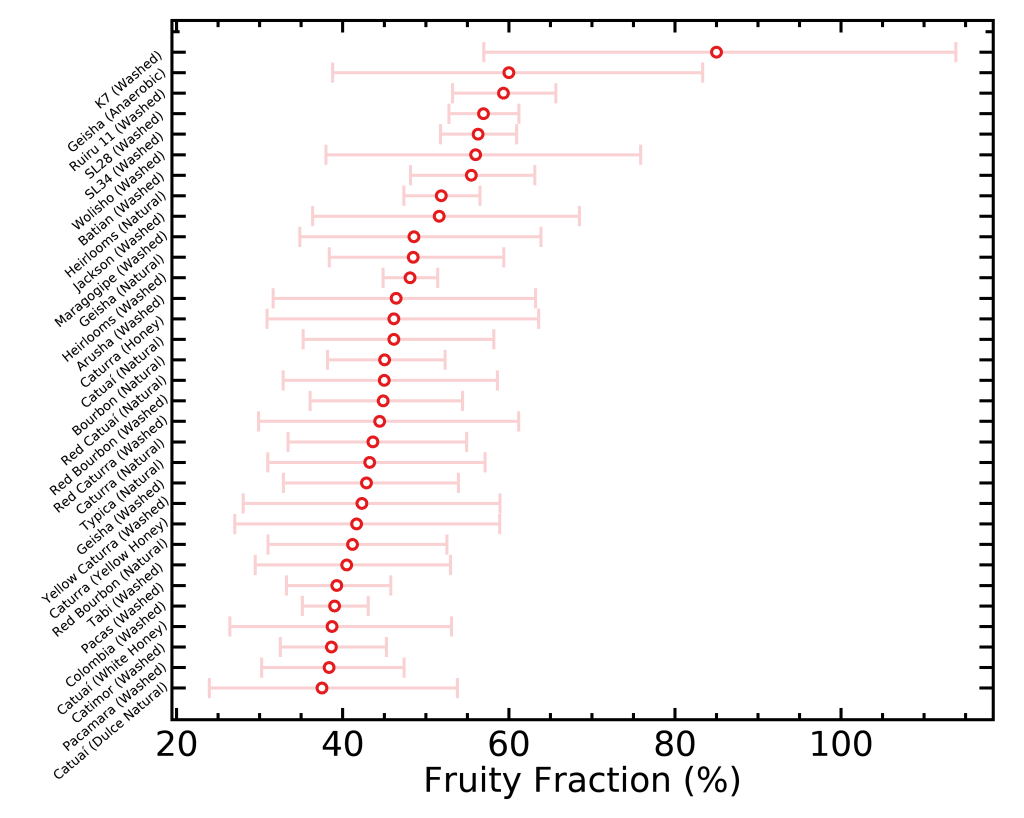
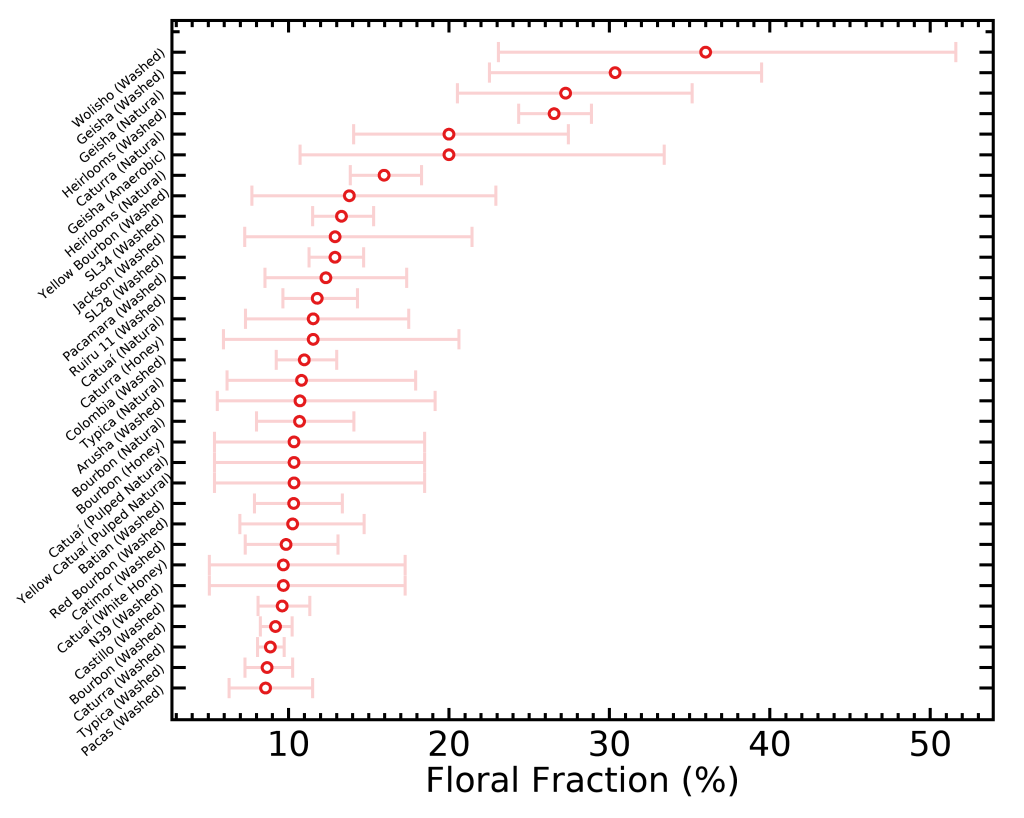

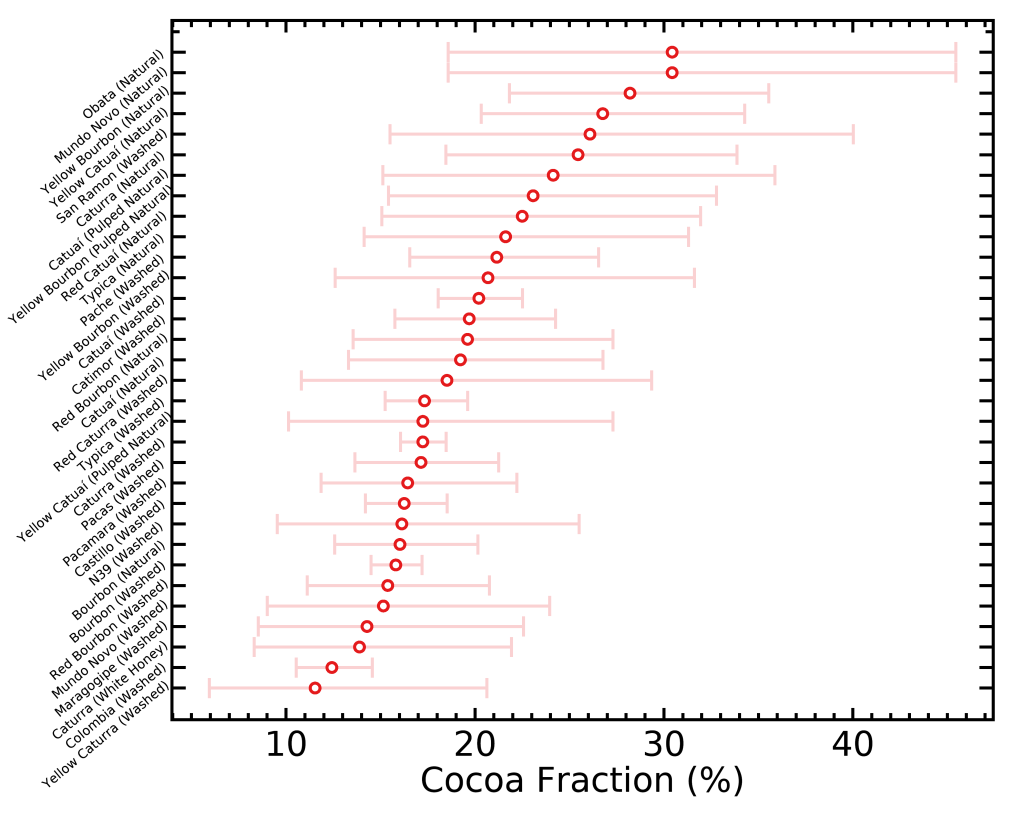
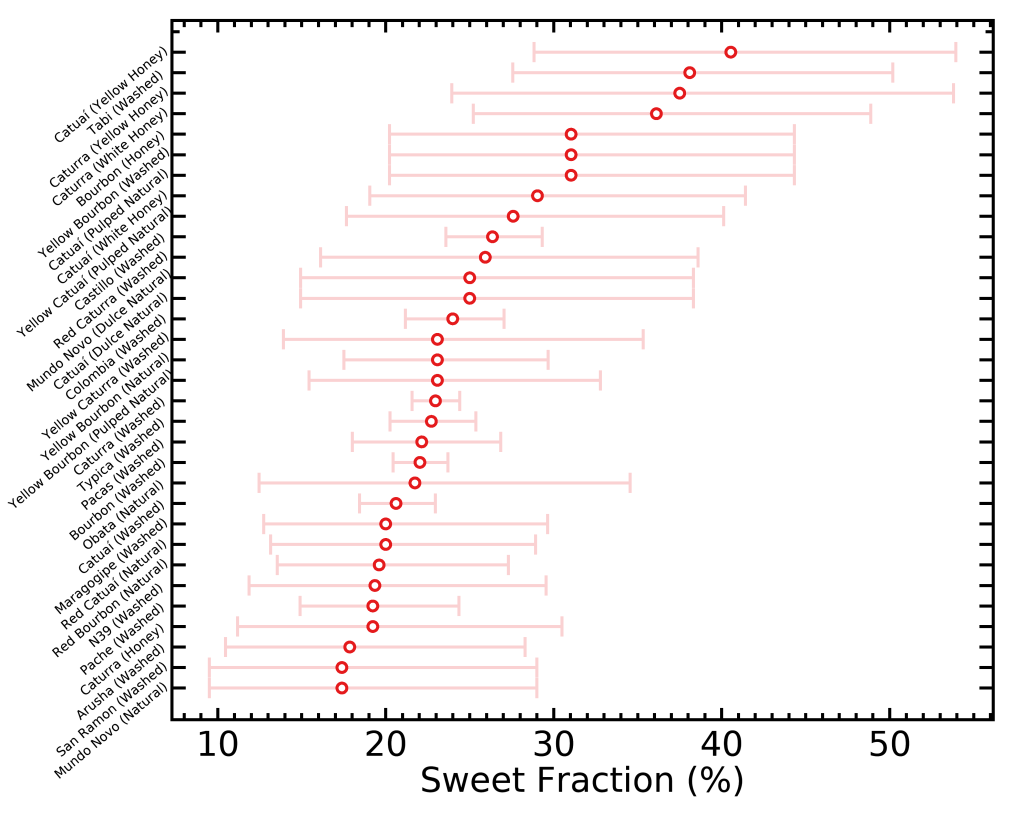
Something interesting Matt Perger noticed in the “Sweet” figure is that smaller beans varietals tend to be on the sweeter side, which could be explained by the more even surface versus core roasting of small beans.
I hope you found this analysis as interesting as I did ! I’d like to thank Scott Rao, Matt Perger and Patrick Liu for useful thoughts and comments, as well as the developers of the Firstbloom app again !
Now, here are more figures I generated ! I made many more ranking figures, available to my Patreon supporters.
Varietal Word Clouds


Processing Word Clouds

If you loved the figures in this post, there are many more like them available to my Bourbon-tier Patreon supporters here, for 30 coffee varietals and 14 processing methods !

Some excellent data analysis here. Would love to see a word cloud combining cultivar (a variety we cultivate) and processing. Would be also great to have an idea of roast degree. Not sure if that is in the data.
LikeLike
Sadly roast degree isn’t in the data in any usable way. That would also be extremely hard as even RoR curves from different machines wouldn’t be comparable. Combining cultivar and processing currently isn’t great for word clouds because it will dramatically reduce the amount of data points – we can do this when we have a lot more data
LikeLike
We wait for future releases :). Thanks for the great work here!
LikeLiked by 1 person
Haha, while you do I’ll wait for more data 😛
LikeLike
Reblogged this on Quaffee and commented:
Excellent collection of data to give an overall idea of what is most commonly identified as a flavour note when linked to cultivar and processing.
LikeLike
Great work really interesting read. I think you should combine the word clouds into one giant poster with coffee in the middle then the varieties / processes around. I would buy that 😁
LikeLiked by 1 person
Thank you ! Haha I actually thought about this but the logistics don’t seem simple
LikeLike
Wonderful stuff! I’d say you’re more of a creational coffee enthusiast instead of recreational. 😉 Would be cool use the model on the same coffees over time to see how the flavor wheels and word clouds change.
LikeLiked by 1 person
Yes !
LikeLike
This is amazing, thank you!!
Can you clarify what you meant by saying, in reference to the word clouds you made for varietal, that you “would however bet that in 10 years, a typical user experience might shift far from the word clouds above”?
LikeLiked by 1 person
Thanks ! I mean that as farmers and roasters improve, we might see better flavor profiles emerge
LikeLike
Okay gotcha. My first thought was that your were referring to climate change and its negative effects that will be seen on flavor, which I guess is sadly also a possibility.
LikeLike
Thanks ! I meant that farming and roasting techniques might improve, affecting the flavor wheels.
LikeLike
thanks for share it !
it is nice visual figures
as refered in your post, there are many factors which effect end quality
example to farming, variety, environment, processing
i’m always having something query that the geisha variety, have it really special quality ?
how you think about that ?
LikeLike
Thanks ! I agree all these factors are important, when we have more data I want to split their effects apart. Yes in my experience the Geisha varietal has some unique flavor characteristics.
LikeLike
Nice job!
I’m surprised you consider “nutty” flavor as a roast defect. To me that’s a pleasant attribute that you find more in lower grown coffee, but definitely not a defect. I would rather put that in the “sweet” category. Curious what other people think?
LikeLike
Thanks ! I’m not too confident about that, as I don’t have as much cupping or roasting experience as I’d like, but I’ve been told about that by people with much more experience than me like Scott Rao. It’s possible not all the “nutty” flavors are due to roast, I’m agnostic about that.
LikeLike
Remarkable effort 😍👏🏼
LikeLike
Could I translate this article to Korean on my blog, Please? It is really helpful.
LikeLike
Sure
LikeLike
I uploaded a part of this. Thank you!
https://coffeexconcept.com/entry/How-Coffee-Varietals-and-Processing-Affect-Taste
LikeLike