
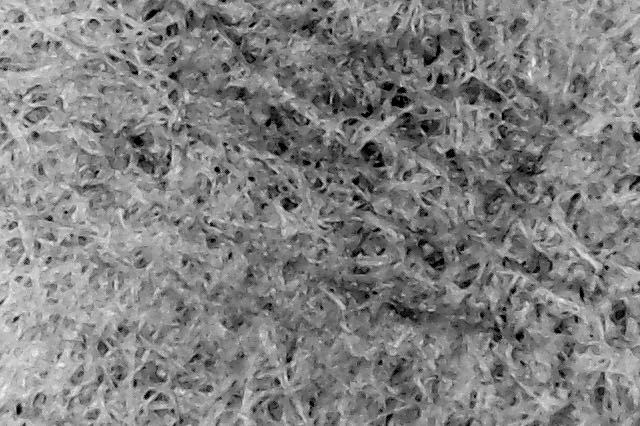
A while ago, I decided to purchase a relatively cheap USB microscope to see what V60 filters look like. This is one of the first images I took of a Hario tabbed paper filter:
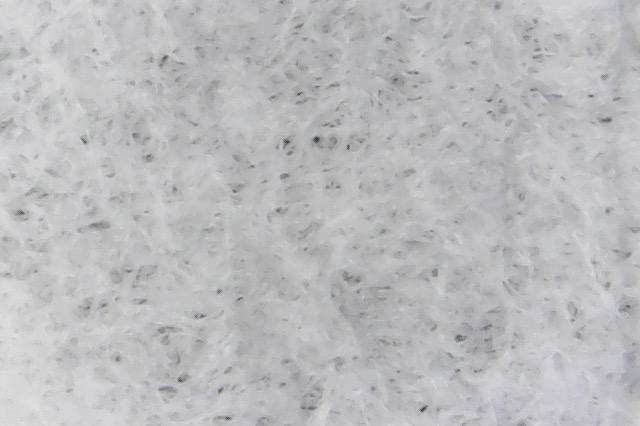
I was really pleased that the microscope had enough resolution to see the filter pores ! This opened up the exciting possibility of characterizing the pores of coffee filters, and determine which ones are optimal for pour over brews. One thing that became immediately apparent is that the pores are not circular, and they don’t seem produced by a perforation of the paper membrane, instead they just seem to naturally occur from spacings between piles of paper fibers.
When I saw that nice image, I immediately grabbed a Hario tabless paper filter and took another image:
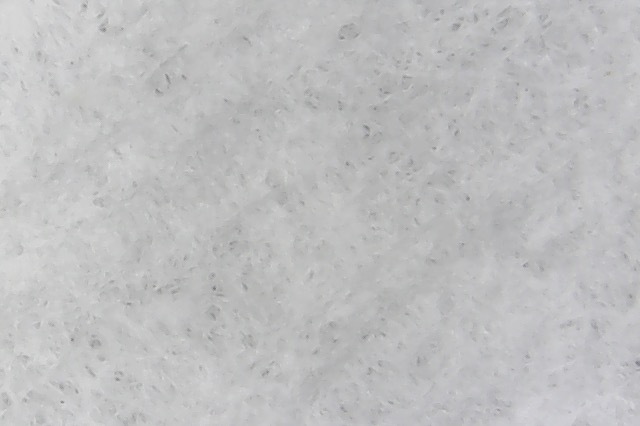
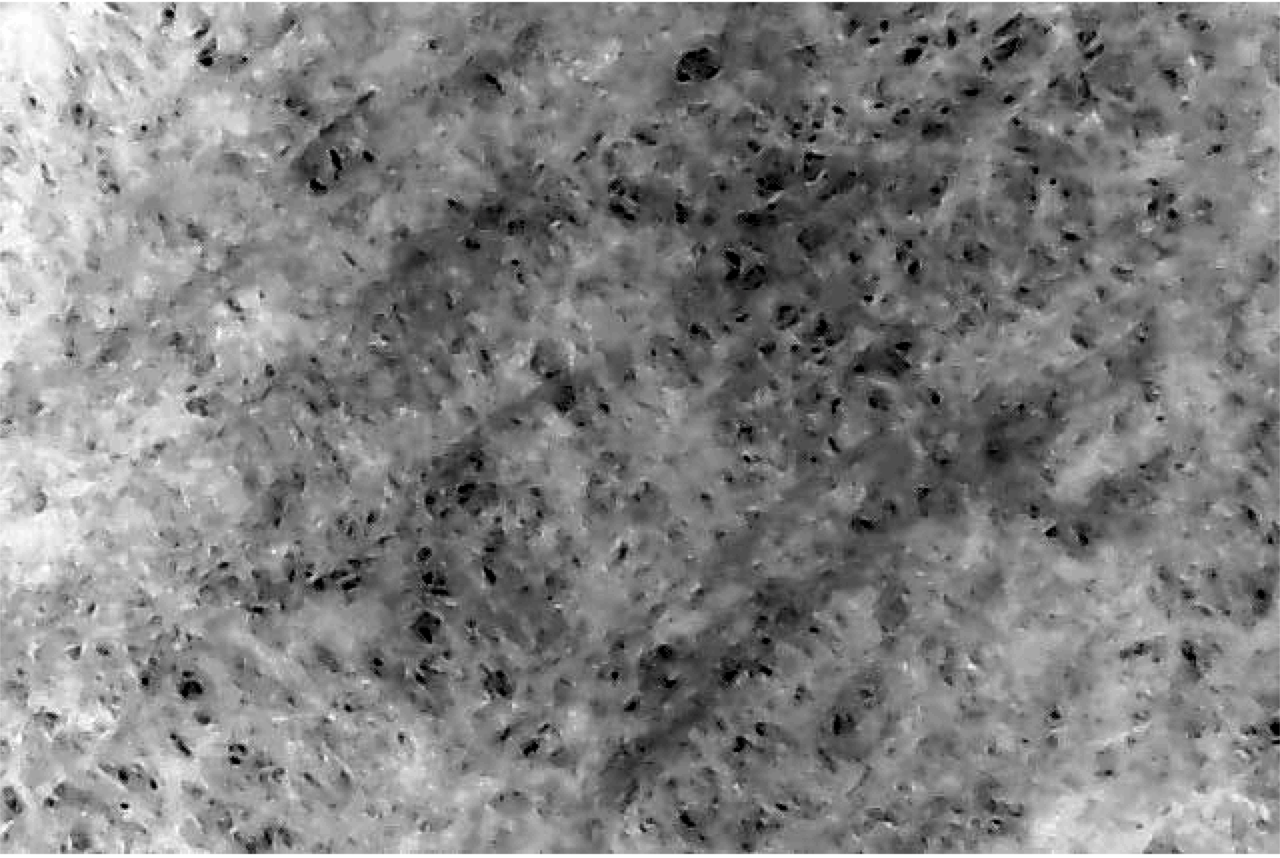
As you can see, this one is less immediately interesting, we can barely see the pores ! After being a bit bummed out about this, I realized it was simply caused by the tabless filters being quite thicker, which minimizes the contrast of the microscope’s LED light bouncing off the filter surface. Fortunately, it’s possible to fix this with a bit of image analysis. To do this, I wrote a code that re-adjusts the contrast of the image so that its pores become more apparent:
By that point, I realized that a proper filter analysis was indeed possible with this microscope, and things started to get really fun. I gathered this list of filters from various manufacturers:
- Hario tabbed V60 bleached paper filters [Amazon]
- Hario tabless V60 bleached paper filters
- Hario tabbed V60 unbleached paper filters [Amazon]
- Cafec V60 unbleached paper filters
- “Coffee Sock” V60 cloth filters
- Aeropress bleached paper filters
- Aesir bleached paper filters for Aeropress brewer
- Chemex unbleached paper filters
- Chemex bleached paper filters
- Osaka metal filter for pour over
- Hario unbleached paper filters for siphon
- Hario cloth filters for siphon
- Whatman Grade 597 quantitative bleached paper filters
Now, before we start discussing the actual analysis, I’d like to show you what each of them look like under the microscope.
Hario Tabbed Bleached Paper Filters for V60

Hario Tabless Bleached Paper Filters for V60

Hario Tabbed Unbleached Paper Filters for V60

Cafec Bleached Paper Filters for V60

“Coffee Sock” Cloth Filters for V60

Aeropress Bleached Paper Filters

Aesir Bleached Paper Filters

Chemex Unbleached Paper Filters

Chemex Bleached Paper Filters

Osaka Metal Filter for Chemex and V60

Hario Unbleached Paper Filters for Siphon

Hario Cloth Filters for Siphon

Calibration of Image Scale
Before these images can be used in a more quantitative analysis, the size of each pixel must first be determined. To achieve this, the microscope comes with a small calibration plastic that looks like this:
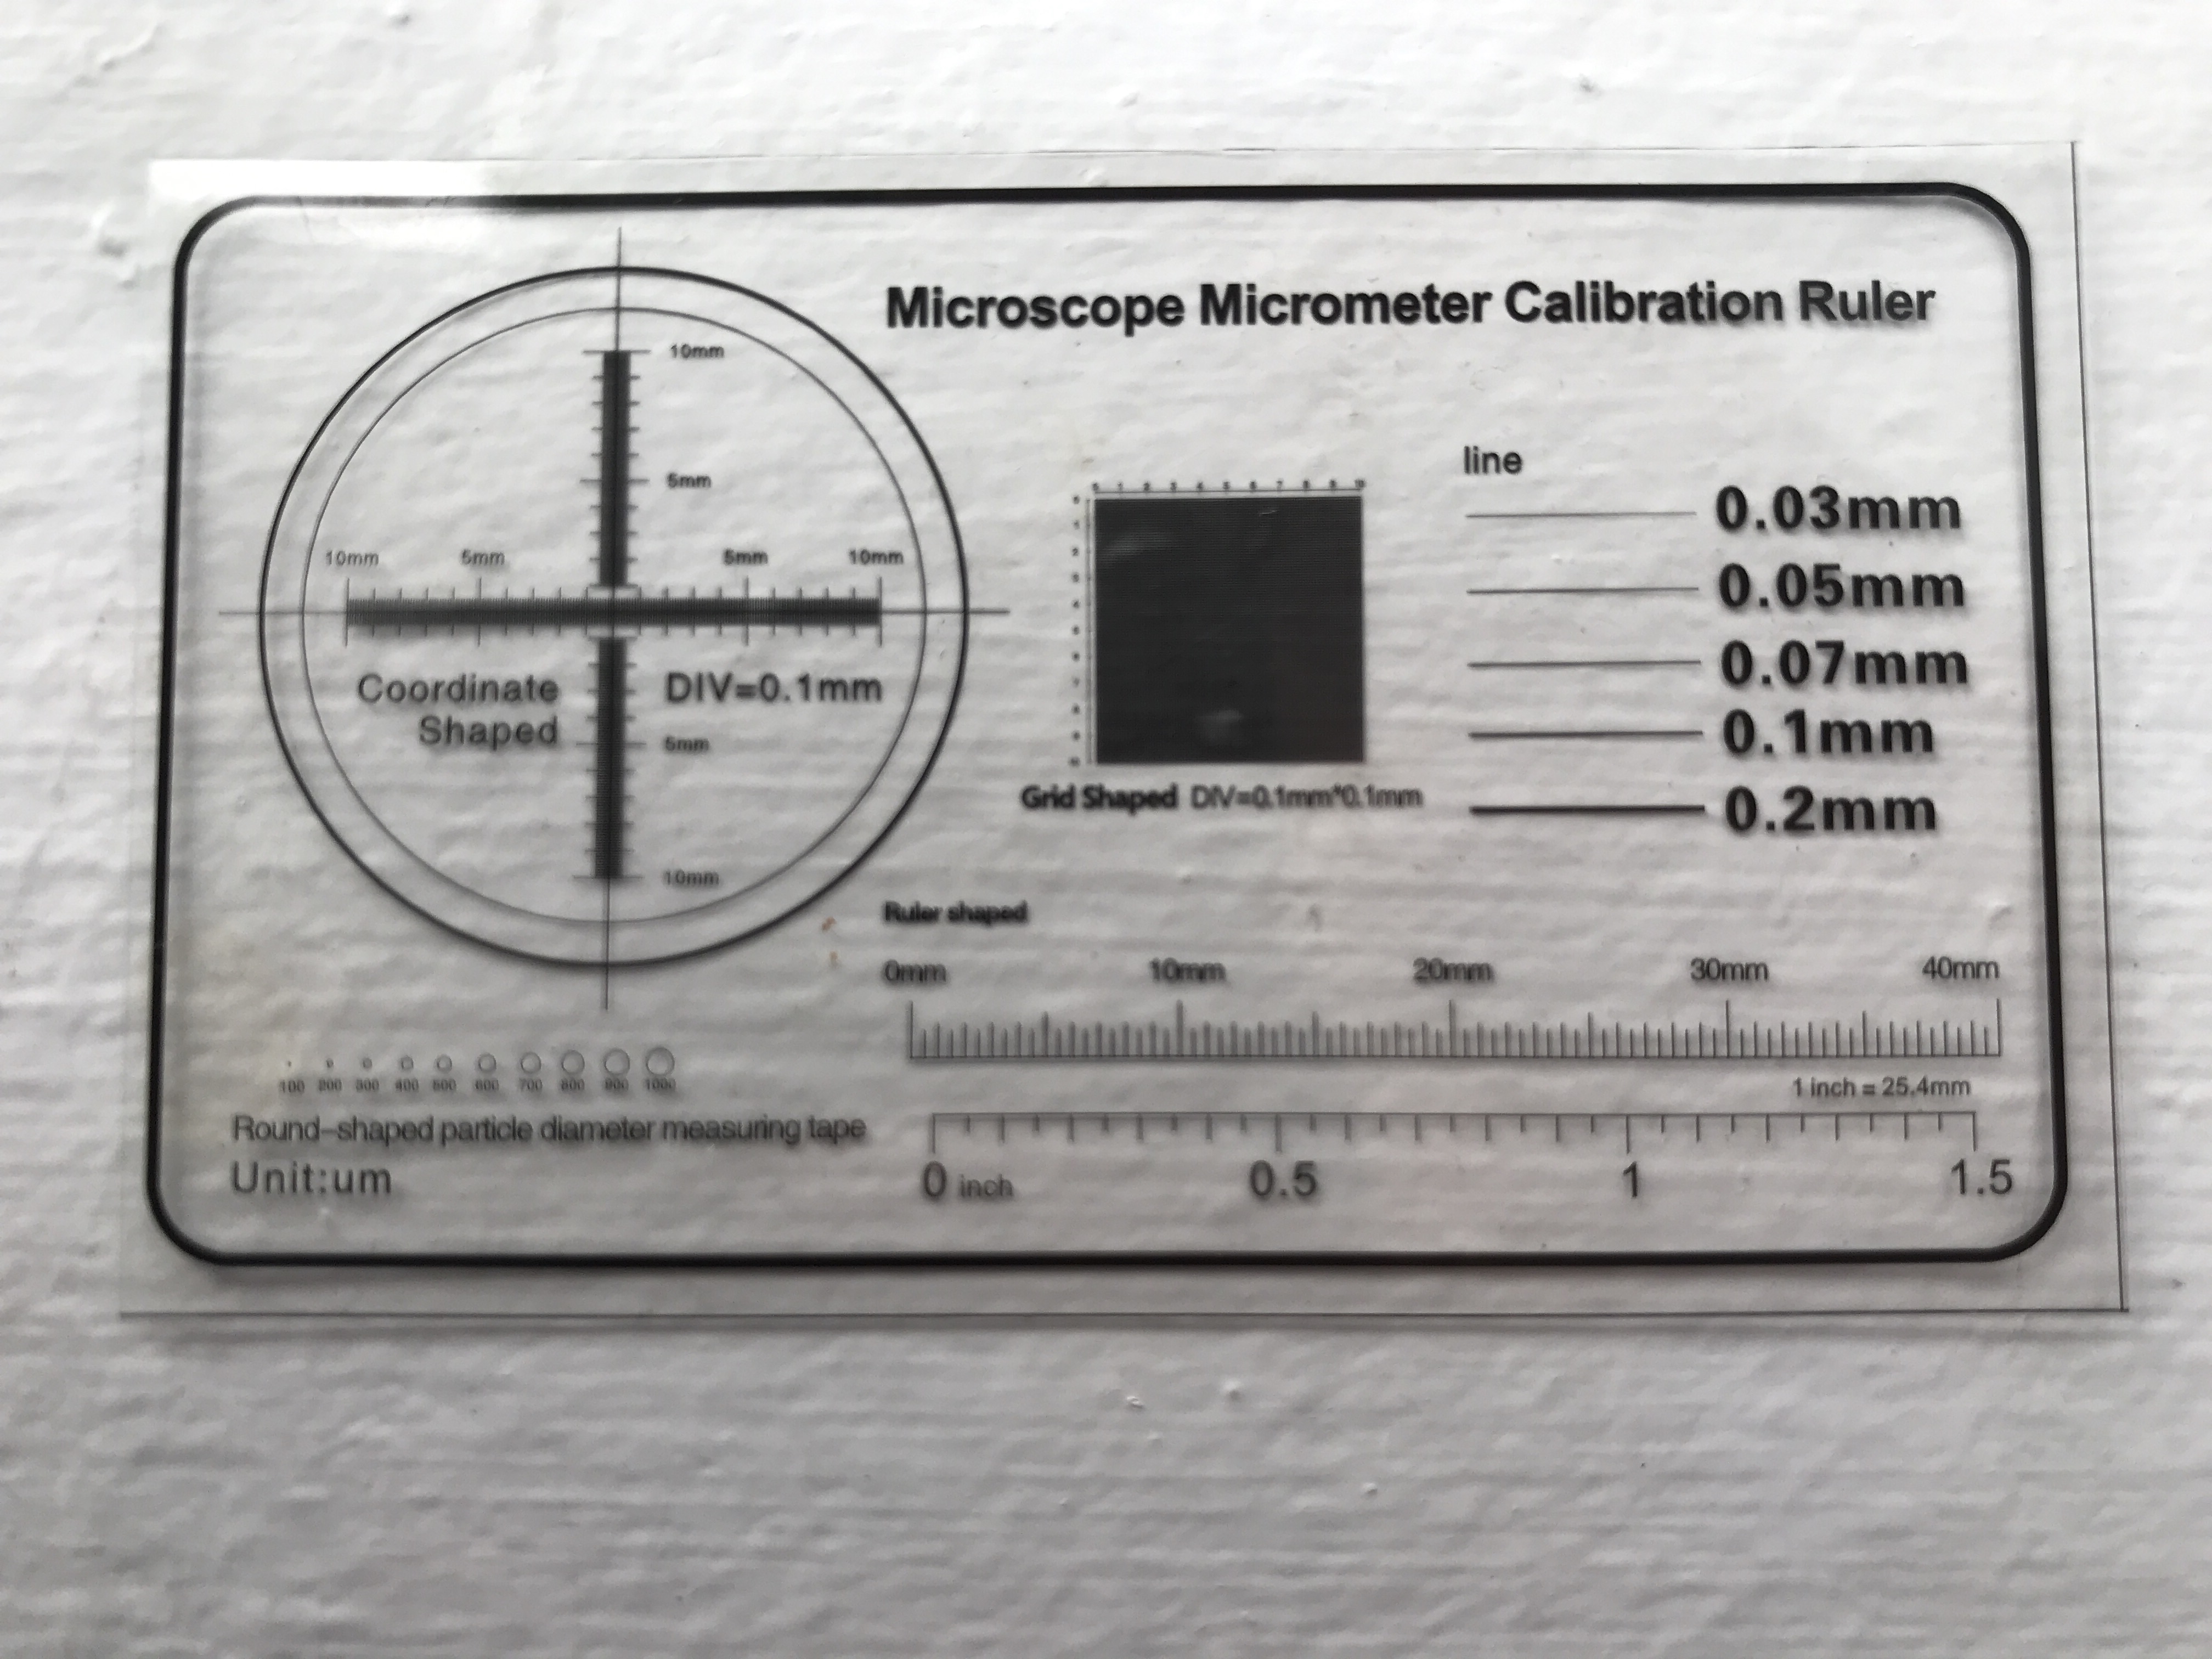
As you can see, there are many options that can be chosen from. I highly suspect that the printing standards for this calibration unit are not particularly great, so I decided to choose the grid in the middle of the calibration plastic; I chose it because it provides many measurements of the scale at once, and it seems much easier for the manufacturer to get the spacing between printed lines right rather than the thickness of a line. I took seven images of this grid at slightly different positions. These images each look like this:

These lines are marked as 0.1 mm (100 micron) wide. You can already see from the image that the line spacings are not perfectly uniform. There are also small defects on the image caused by imperfections in the plastic. I chose to take the median value of each row (a vertical median) to create a 1-dimensional signal of this grid, which as you can expect looks like an up-and-down pattern (dark pixels where a line falls, white pixels otherwise). I then used what is called an auto-correlation of that signal to determine by how much it can be shifted before lines overlap with each other. I did this on the seven images that I took; I then took the average pixel scale as my best measurement, and the standard deviation as the statistical uncertainty in my measurement. This measurement error does not include any systematics. For example, if the manufacturer actually printed a pattern of lines averaging 110-micron wide spacing, that 10 micron systematic error won’t be included in my error estimate. Because I have no way to know about such systematics, I just ignored them.
I also repeated a similar analysis with a vertical median instead of a horizontal one, to check that the pixel sizes are the same in the vertical and horizontal directions. Here’s what I found:
- Horizontal scale: 67.59 ± 0.09 micron per pixel
- Vertical scale: 67.54 ± 0.07 micron per pixel
As you can see, the two values agree within the error bars, which is encouraging. Therefore I assumed that the scaling is the same in both directions, and combined them together to obtain a final image scale estimation:
- Combined scale: 67.56 ± 0.08 micron per pixel
Analysis of Pore Distributions
Now it’s time to get even deeper in the technical details. As I mentioned, one of the more useful things to do with these microscope images is to determine the uniformity and quantity of pores in each filter. To do this, I opted to do some image smoothing with various bandpass sizes.
The unbleached paper filters I analyzed are brown rather than white. Because I don’t want color to affect my results or make it harder to bring out the contrast between the filter surface and its pores, I experimented visually and determined that adding up 100% of the red channel and 50% of the green channel was a good way to mitigate the effect of brown color on the detection of filter pores. I used none of the blue channel, because brown is a color that contains very little blue in it, and this means that the undesirable brown-white variations in color across the surface of an unbleached filter are maximized in the blue channel.
Here’s what an original color image of a Hario unbleached filter looks like:

If we look only at the (contrast-scaled) blue channel, variations in brown shade will be very obvious:

If instead we looked at the combined R+G+B channels, these variations would get diluted a bit:

But taking the red channel plus half of the green channel gets us something that removes these variations even more:
As I mentioned before, an important step is to re-normalize the image contrast in order to see the pores clearly regardless of filter thickness. In astronomy, I need to do this all the time and by experience one efficient way to do it that is robust against outlier pixels is to subtract the 0.5th percentile of the image everywhere (i.e., subtract almost the smallest image value), then divide the image by its 88th percentile (i.e., divide by almost the largest image value). I then set any outlier pixels darker than zero to exactly zero, and any outlier pixels brighter than 1.0 to exactly 1.0.
Here’s what the image above would look like before applying such a contrast normalization:

The pores are much harder to see in the image above, compared to this one where the contrast was normalized:

There is another neat trick that can be used to remove large-scale variations across the image very efficiently, as long as they are larger in scale than the largest possible pores. Basically, you divide the original image by a smoothed version of itself, and this brings out only the small-scale variations across the image. I used a Butterworth filter to do this; it uses a slightly different bandpass to smooth the image compared to the more typical Gaussian smoothing, but I found that it was better at preserving the exact pore shapes. In all cases I removed only the 10% largest spatial frequencies in all images with this step.
Here’s how the Butterworth filtering affects the image above:

As you can see, this removed a lot of the variations caused by creping or shadows.
Another step I took is to blow out the image resolution by a factor 20 using an interpolation algorithm. This allows me to measure pore sizes at the sub-pixel level, and obtain smoother pore size distributions with more data points in them. The next step to detect filter pores is to choose a threshold to separate a pore from the filter surface. I used a threshold of 0.5, which means that any pixel darker than half of the image scaling is considered a pore. You can see visually what this results in, with all detected pores marked in red:
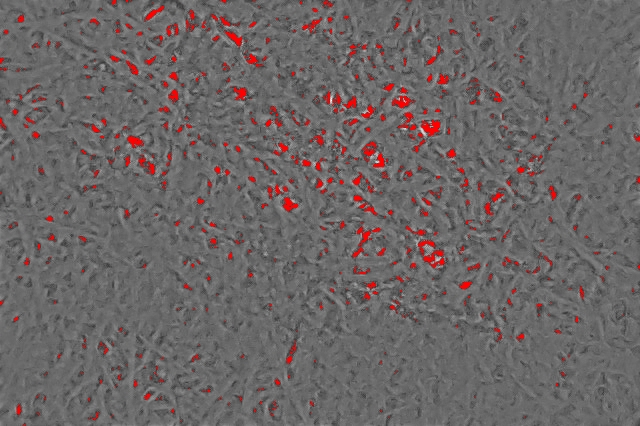
At that point, I simply counted the fraction of pixels that were marked as pores in this image.
if you are not interested in the details of how I coded the construction of pore size distributions, you can skip the next paragraph, and the equation !
To do it, I used the magic of infinite numbers in coding. In some coding languages, those are called “Not a Number” (NaN), and they can either be your worst enemies because they crash all of your software, or your best friends because you always keep them in mind and ensure your codes don’t crash when they are encountered. Believe me, they should be your friends, because they open up a lot of nice coding tricks. One of these tricks is the following: You can create a mask image that has a value of 0.0 at every pixel corresponding to the filter surface, and NaN at every pixel where there is a pore. You can then use some fast and well-vetted box-smoothing algorithms to look at the larger scales in the image, and this will cause the filter surface to slowly creep inward and close down the detected pores.
Do this with many different smoothing box sizes (let’s call such a box size x), and you will gain information on the fraction of filter pores at every size ! Another neat trick about the dynamics of how NaN values creep inward is that they will give you a list of pixel locations where square particles of a maximum radius of exactly x can pass through the pores; normal smoothing algorithms would underestimate what size of particles can pass because they would blur the edges of filter pores. If you count the fraction of masked pixels (let’s call that m) for every box smoothing size (recall that we named this x), it can be demonstrated mathematically (I will spare you the details) that the distribution of pore radii f(x) is related to the second derivative of the masked fraction versus smoothing box size:

where p is the pixel scale (in pixels per micron).
Basically, how much the fraction of masked pixels changes as you are smoothing the image gives you an indication of how much pore surface is being closed down.
I found this algorithm efficient to quickly measure pore sizes regardless of their shapes across the image, and measuring m(x) is basically asking “If you take one squared particle of radius x, what is the fraction of surface positions where it could pass through a filter pore ?“
These calculations resulted in a pore size distribution for each microscope image that I obtained. I then combined the distributions from every image of a given filter to an average pore size distribution for that type of filter. I displayed pore diameters rather than radii, because I suspect this is what most people will assume if they hear “pore size”. Here’s an example of what I obtained with the Hario tabbed paper filters:

As you can see, the peak of the distribution in terms of number of pores seems located below the spatial resolution of the microscope, but we will see later that this is not an issue given that we are interested in how the pore distribution affects flow rate, and we will see that the pores smaller than 10 micron have an insignificant contribution to flow for all the filters that I tested.
Here’s how the distribution of each filter compared:

As you can see, the Osaka metal filter has way more pores than the other filters. I find it more interesting to compare the normalized pore distributions, and to group them by brew method:
Pour Over

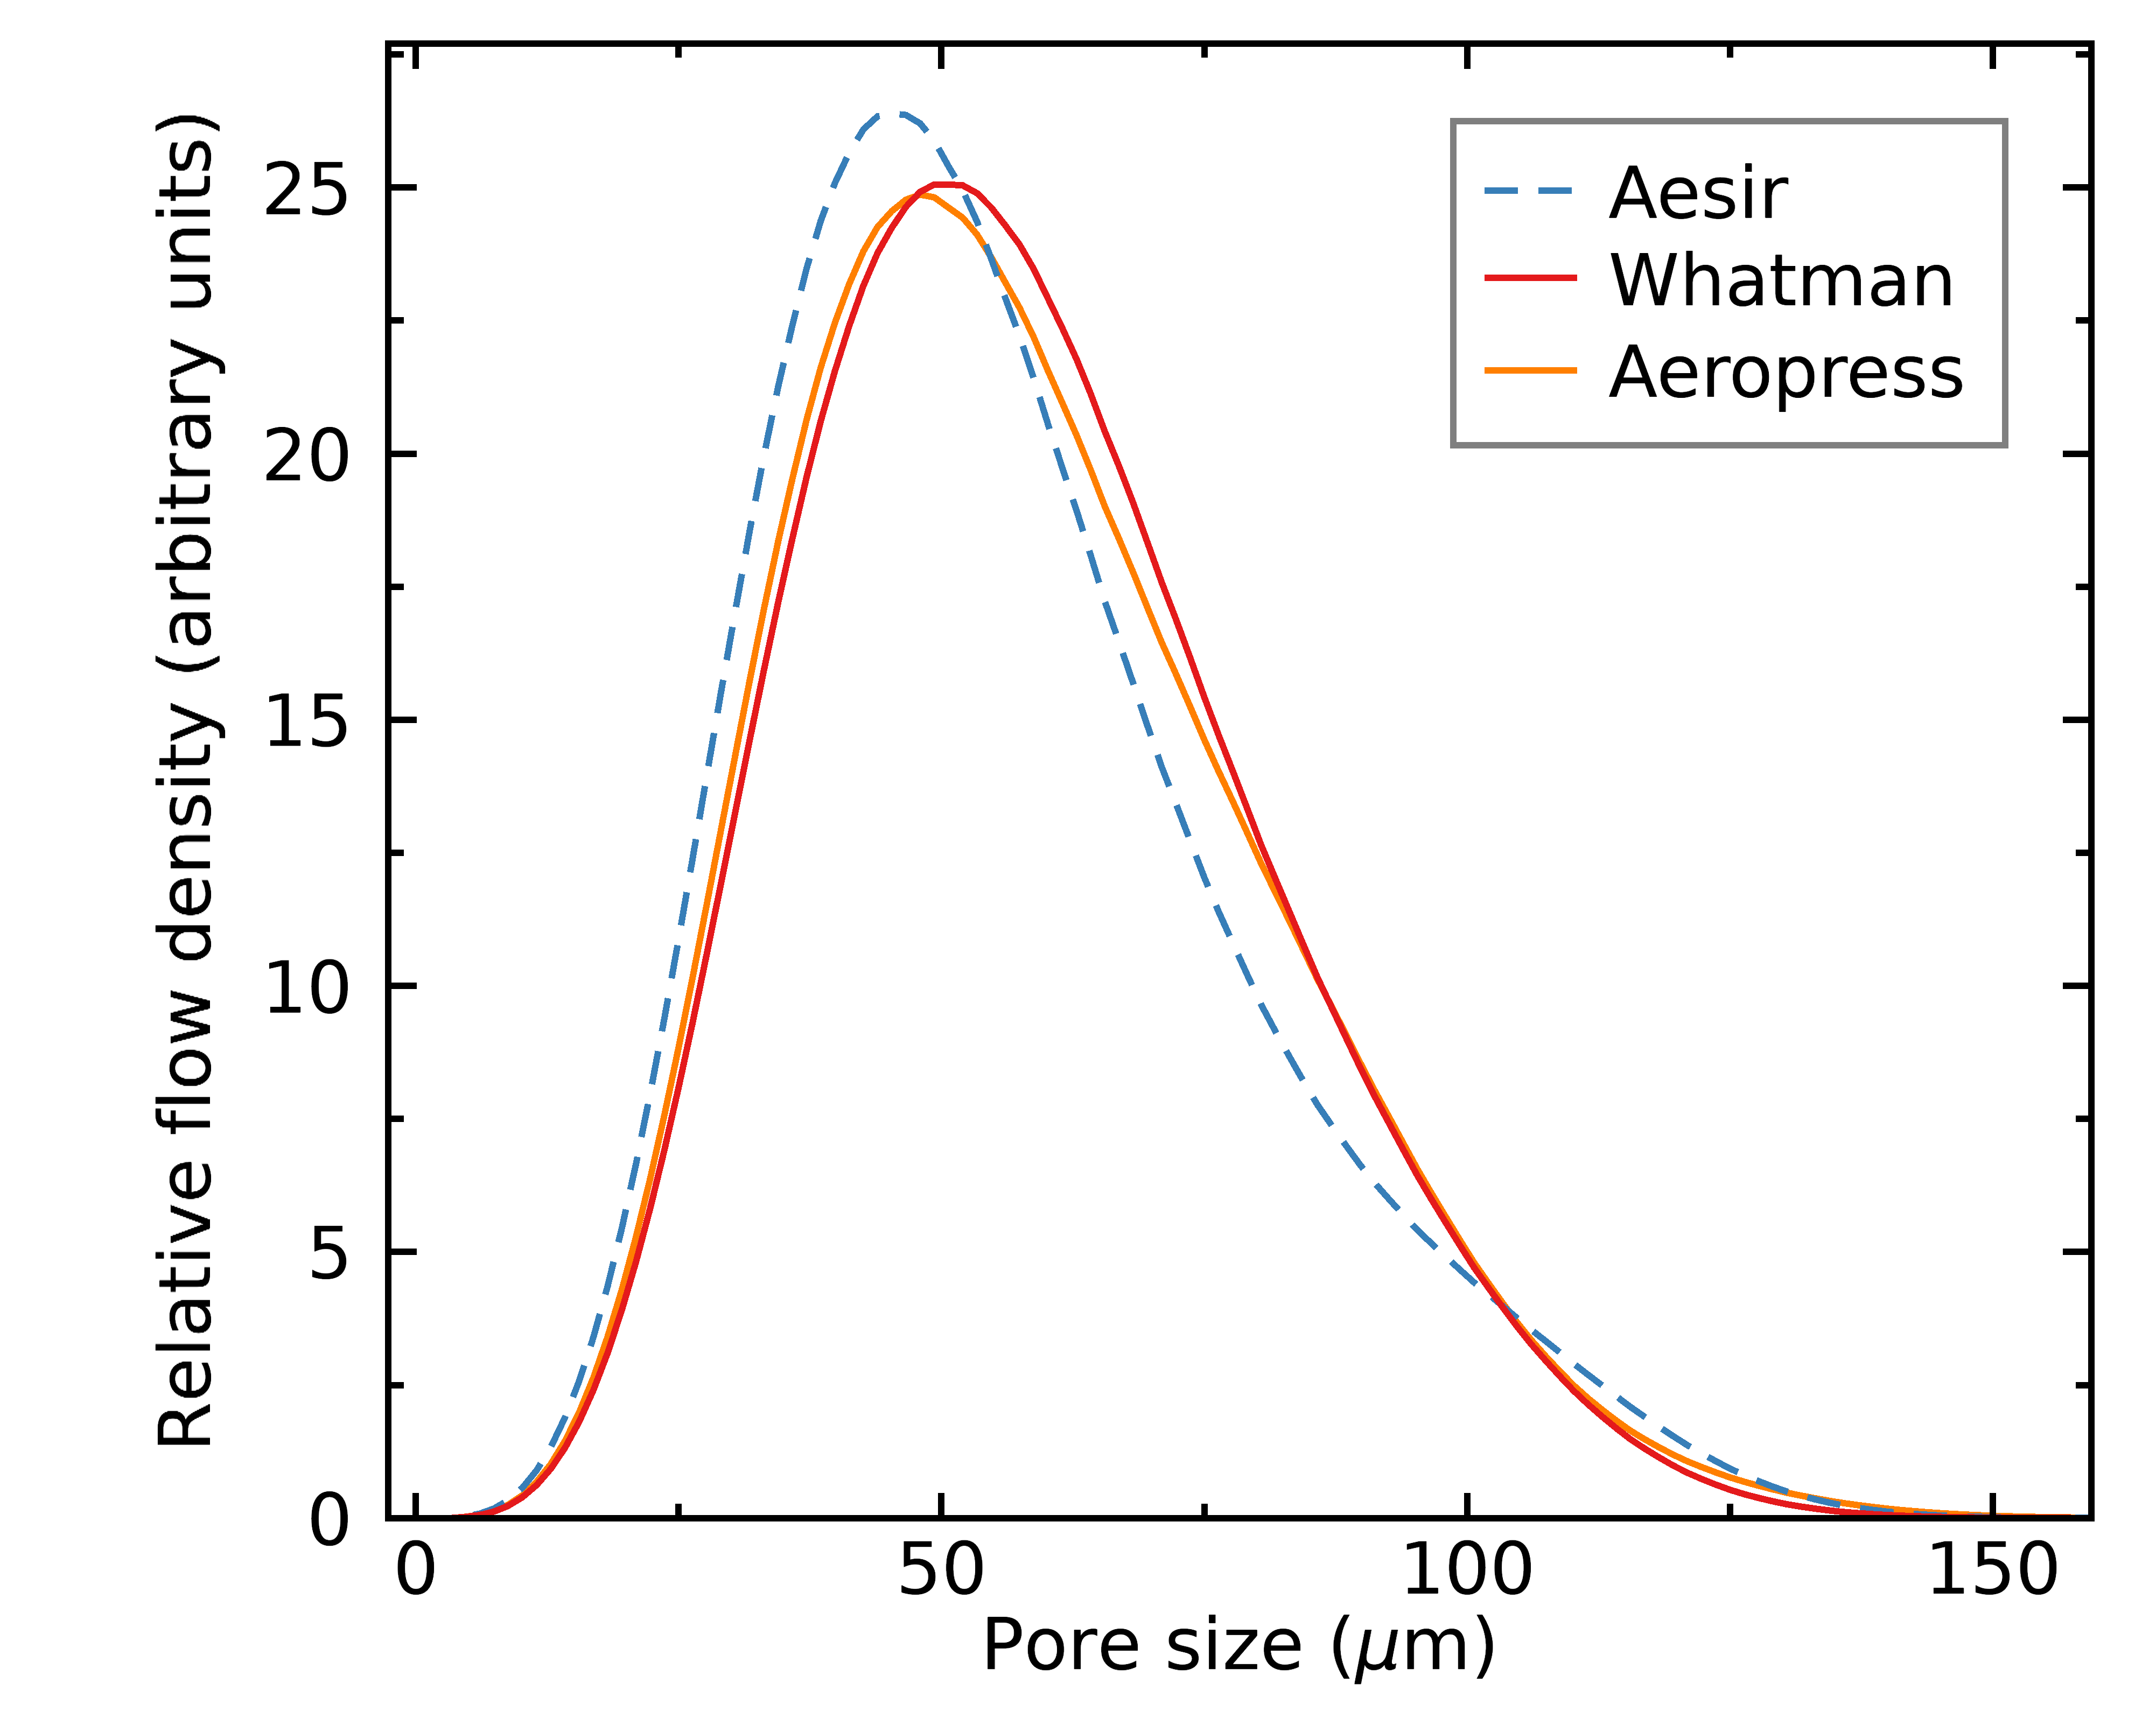
Aeropress

Siphon

As you can see from the distributions above, paper filters tend to have more uniform distributions in pore sizes (the slopes of the distributions are steeper). One thing I found really interesting is that all unbleached filters seem even more uniform. This hints that the bleaching process may be affecting the pore distributions of filters, possibly in a way that will hurt brew quality, but we’ll come back to this later.
The units of the distributions above can seem a bit confusing, as they are in number of pores per micron per millimeter squared. The “per micron” part is caused by these distributions being probability densities, i.e., you need to integrate their area under the curve to obtain a real number of pores, which will remove the “per micron” unit. The “per millimeter squared” is just the surface of the filter. If you integrate all of these distributions across all possible pore sizes, for example, you could count how many pores per millimeter each filter type has. With a slightly different operation, you can also calculate the fraction of each filter’s surface that consists of pores (I removed the metal filter to get a clearer figure):

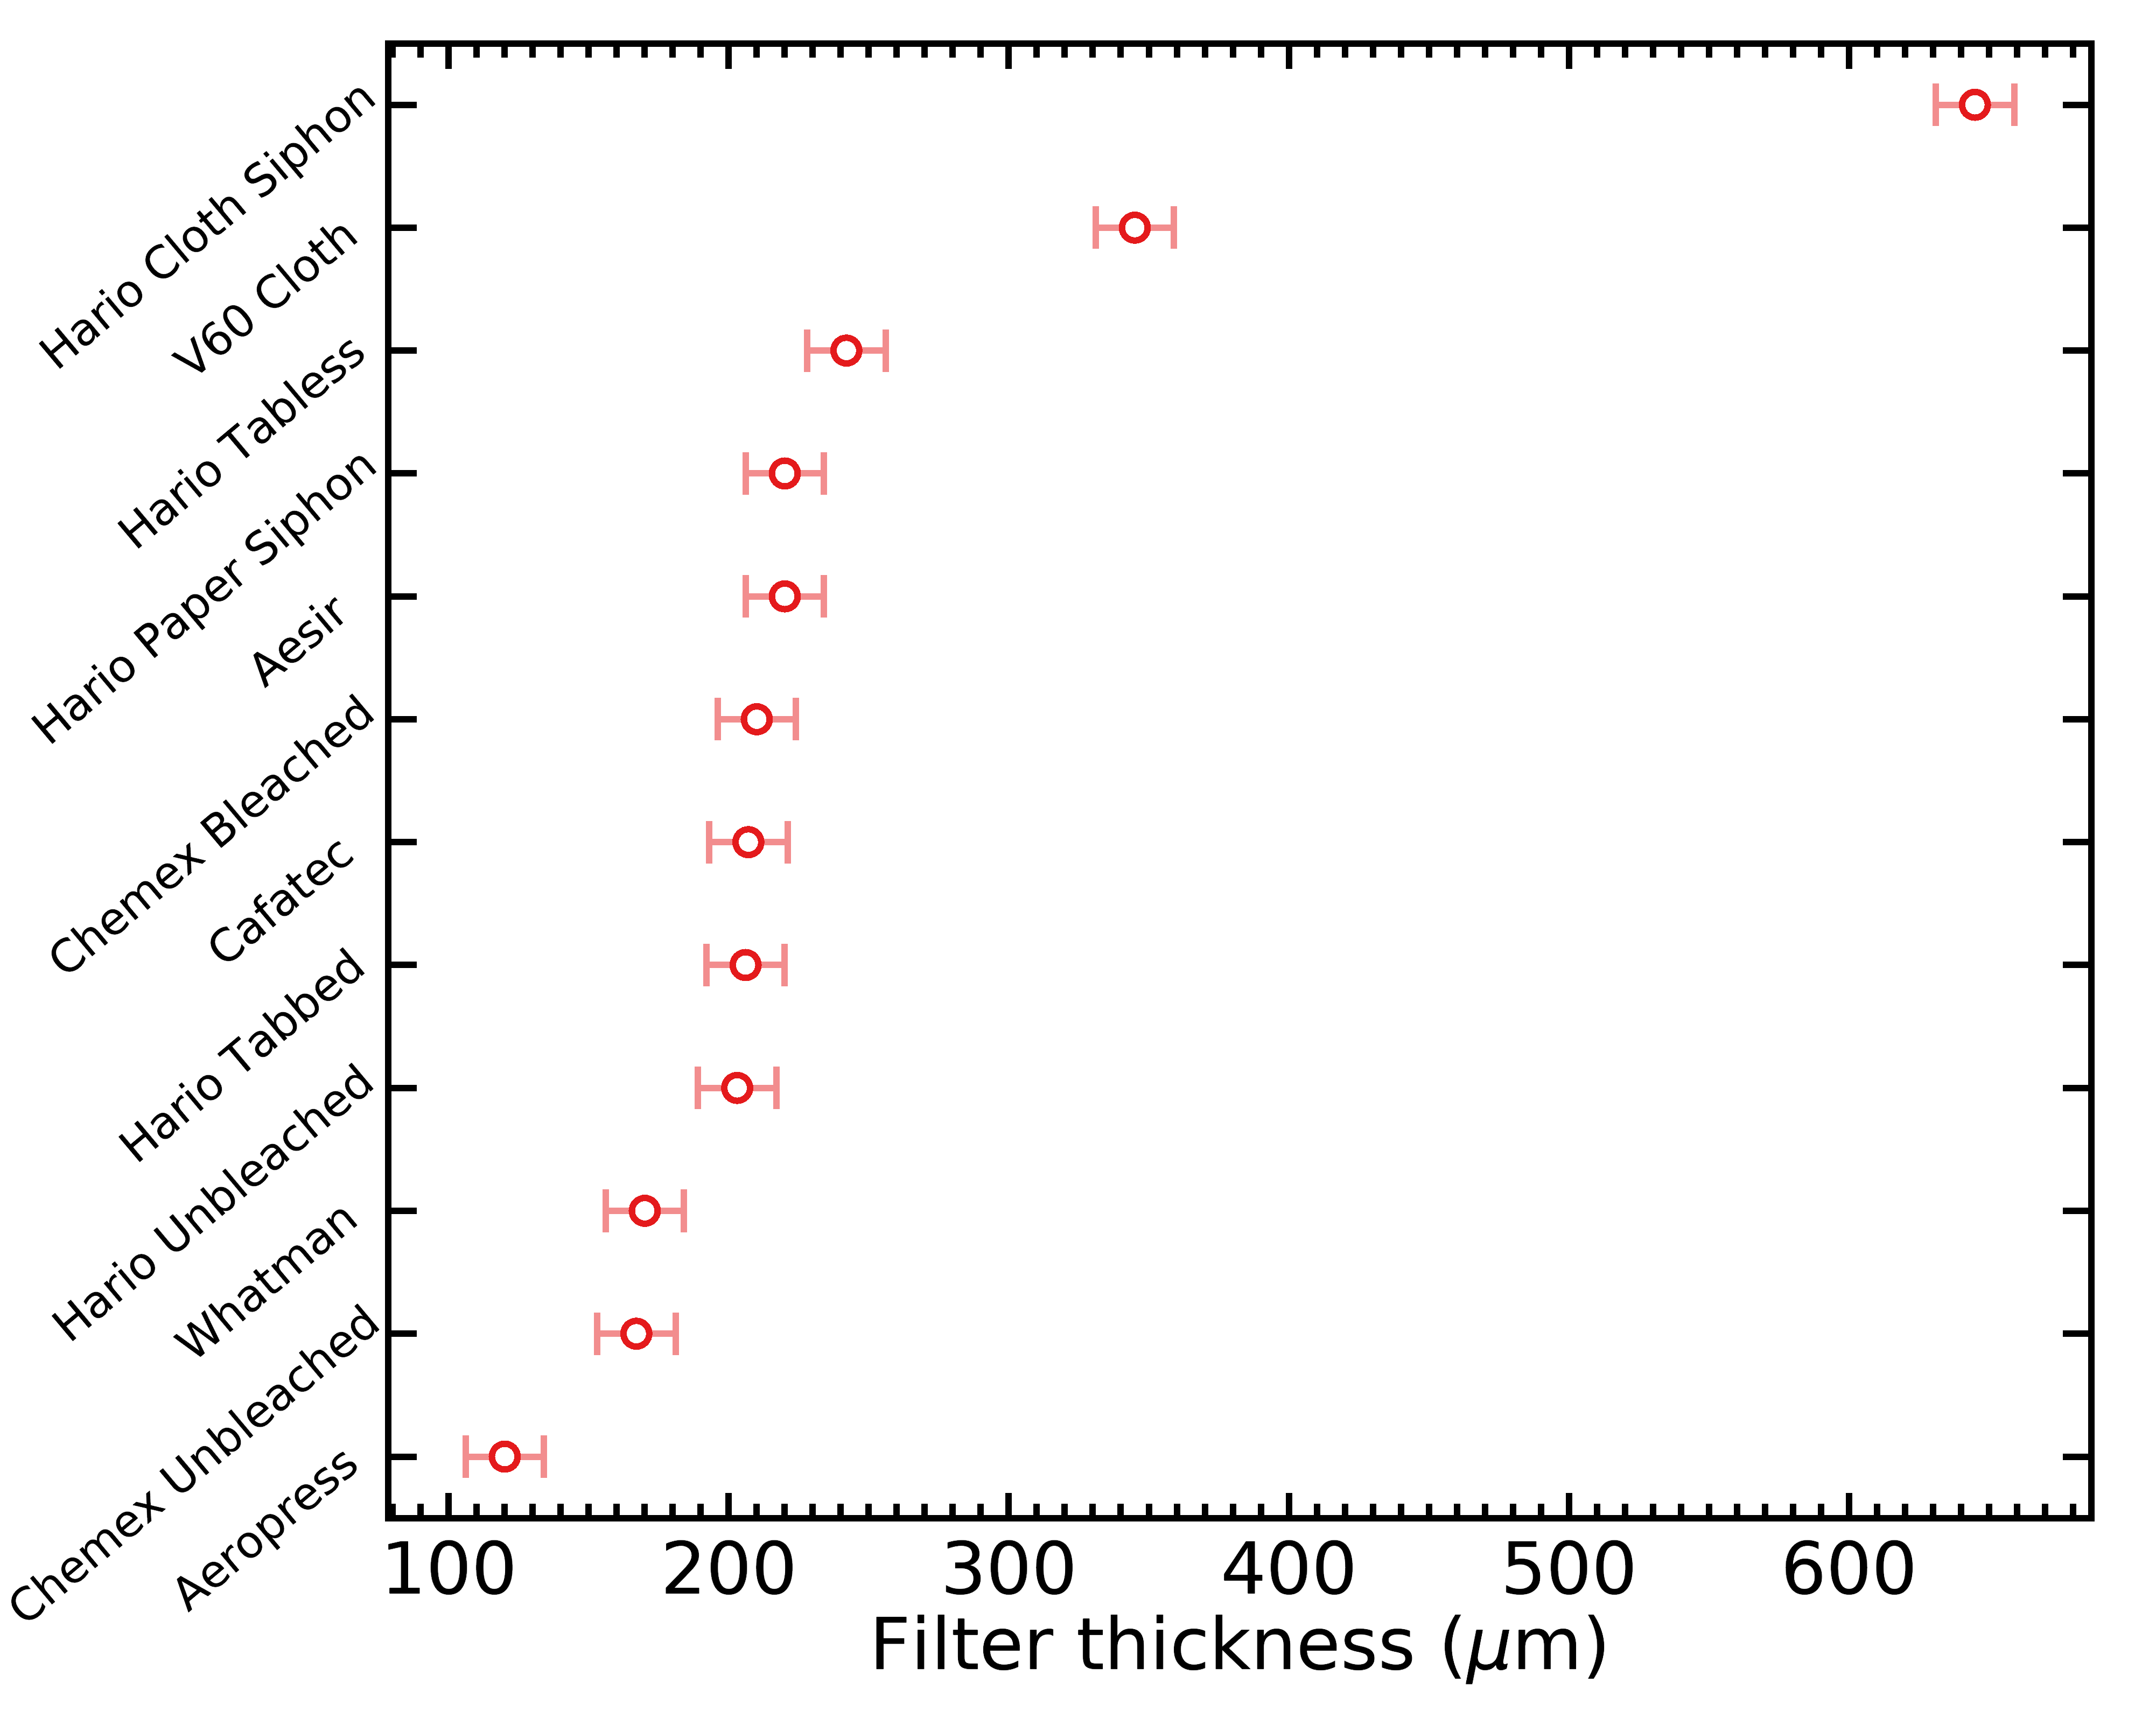
Filter Thickness
It is obvious from manipulating all the filters above that they have very different thicknesses. This is an important property of filters because it will affect their flow rates. I thus ordered a digital Caliper with a 20 micron precision to actually measure the thickness of every filter. Precisely measuring the thickness of a paper filter is actually not as straightforward as you might think; if you close the Caliper too hard, the filter will get compressed and potentially damaged, and you won’t measure a realistic thickness in the context of water flowing through the filter.
To overcome this problem, I gently closed the Caliper on each filter to obtain a more realistic thickness, but this brings up a whole new problem of measurement reliability. Fortunately, I can easily repeat these measurements many times on different filter locations, and different filters, so I kept taking measurements until my error on the average thickness became much smaller than the quoted 20 micron precision of the Caliper. Stats geeks will know that this error on the average can be calculated with the standard deviation of all values divided by the square root of the number of values.
I ended up taking a total of over 700 thickness measurements (across all filter types) before I was confident in my results. Here’s the list of filter thicknesses what I obtained:
- Chemex unbleached: 167 ± 23 μm
- Chemex bleached: 210 ± 22 μm
- Hario unbleached: 203 ± 21 μm
- Hario tabbed: 206 ± 21 μm
- Cafec: 207 ± 21 μm
- Hario tabless: 242 ± 22 μm
- V60 cloth: 690 ± 22 μm
- Aeropress: 120 ± 22 μm
- Whatman: 170 ± 22 μm
- Aesir: 220 ± 22 μm
- Siphon paper: 220 ± 22 μm
- Siphon cloth: 645 ± 22 μm
And here’s the same data, displayed as a figure:
Filter Flow
Another important point about filter properties is how fast water flows through them on average. This is affected by factors like pore size distribution, filter thickness, but also their rigidity and how well they stick to the surface of a V60, because a better sticking filter will slow down the upward escape of air and therefore slow down flow. Because flow rate is a function of many complex and intertwined factors, I also measured them with a simple experiment further down.
We can however make a prediction of flow rate, based on an idealized planar filter with a uniform thickness and circular holes. The theory behind it is given in some details here, but basically the only part you need is this one:

where q is the flow rate in volume of water per second through a pore, r is the radius of the pore, and t is the thickness of the filter. The hidden proportionality constants are related to the pressure drop above and below the filter, and the viscosity of water. The first term in the third power of r is called the Sampson term, and corresponds to the case with a filter much thinner than its pore sizes. The second term is called the Poiseuille term, and corresponds to a case where the pores are actually tubes much longer than their diameter. This combination of the two extreme cases is not perfectly exact, but it’s much simpler than the real solution, and it’s always a valid approximation within 1% of the real value.
We can use the equation above to transform the distribution of pore sizes into a distribution of flow, and by integrating the full distribution we can estimate the total idealized flow rate for each filter. Here’s what I found, grouped by brew method;
Pour Over

Aeropress
Siphon

As you can see from the figures above, pores above ~20 micron are responsible for most of the flow in all cases. This means that my microscope resolution (each pixel is 6.8 micron) is able to resolve the holes most relevant to understand the flow dynamics. You might be surprised that the positions of the Hario tabless vs tabbed paper filters were swapped compared to the pure pore distributions (i.e., Hario tabless seemed a bit more uniform in terms of pore sizes, but less uniform in terms of flow); this is because the tabless filters have a slight over density of very large pores, which are much more important than small pores when we talk about flow. Hence in practice, this makes the Hario tabbed filters seem slightly preferable.
Here are the total idealized flow rates for all filters, obtained by integrating the flow rate distributions above:

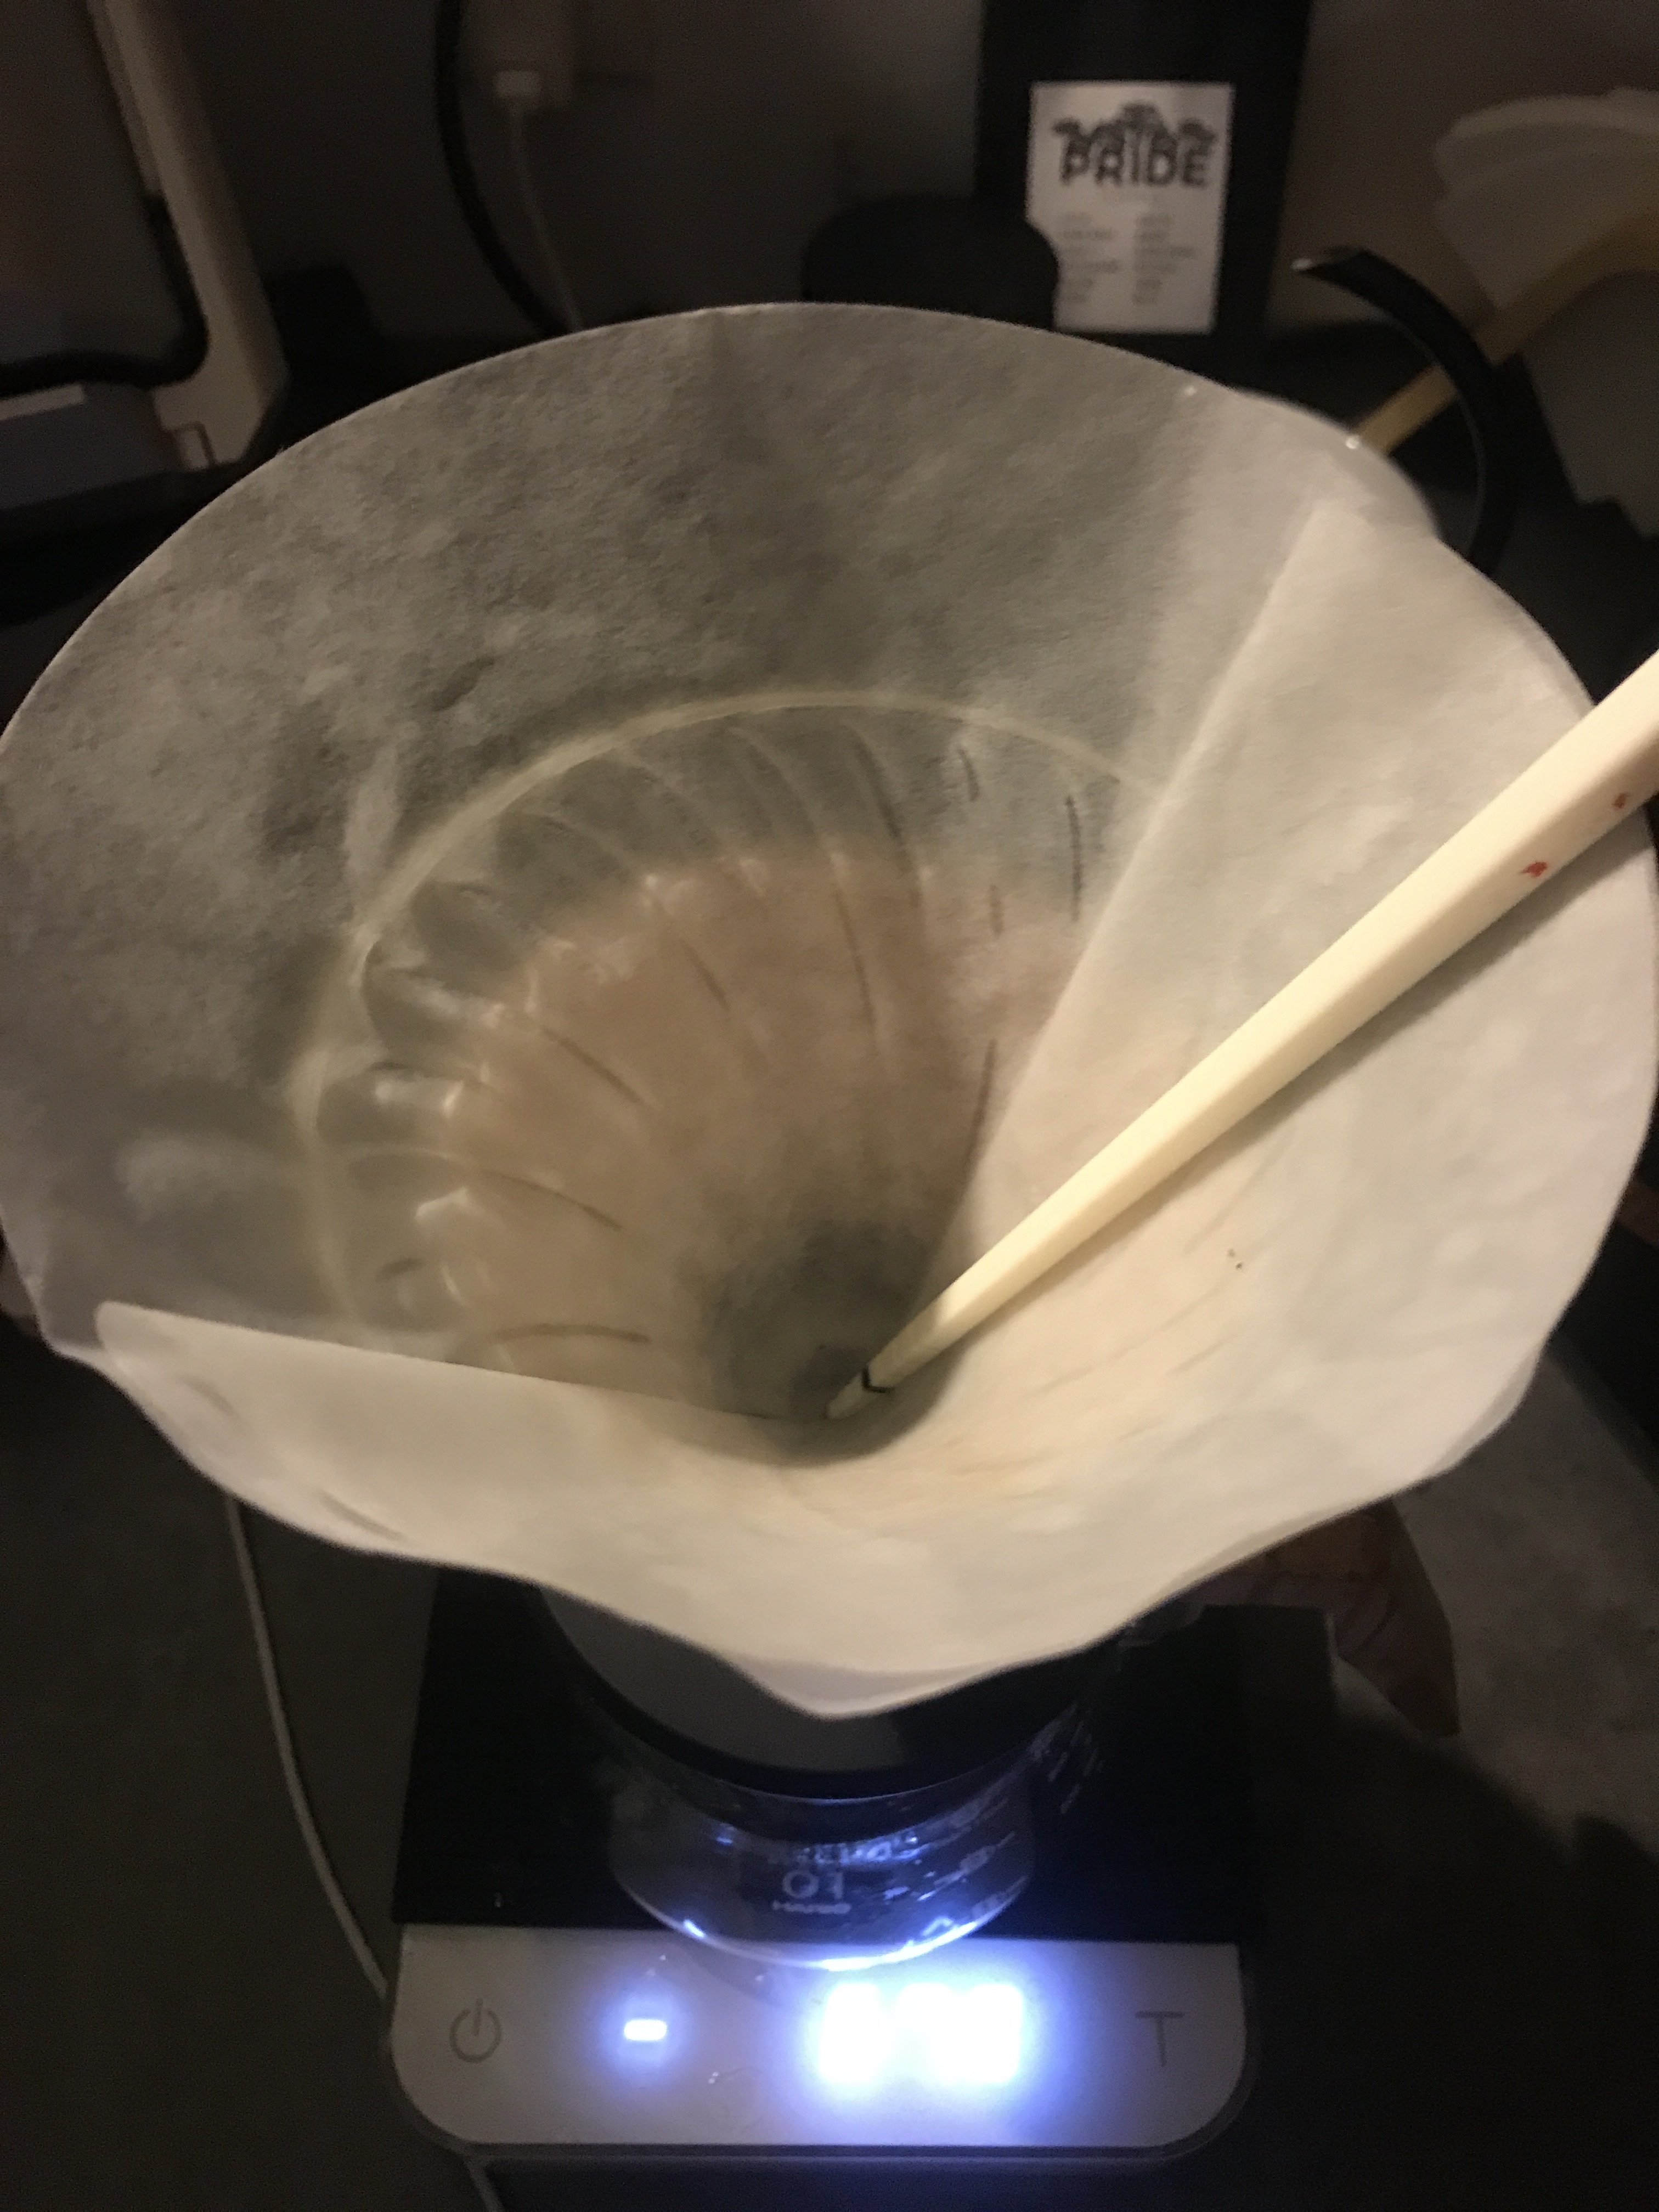
After calculating these idealized flow rates, I went ahead and measured the real flow rates of all pour over filters above. I took the immersion dripper switch from Hario, put a filter on it and stuck a marked chopstick in the filter. I used 150g room temperature (25°C) distilled water to pre-rinse the filter so that it sticked to the V60 walls, turned off the switch so that it doesn’t flow, and added another 150g of room temperature distilled water.
I used an iPhone chronometer which allows you to place your finger on the “start” button and it actually only starts when you release your finger; this makes it easier to trigger both the Hario switch and the chronometer at the same time. Once the switch was opened, I used the iPhone LED light to pay careful attention to the water surface and I hit the chronometer again when it passed the black mark on the chopstick. I took 6 measurements per filter; this allowed me to get a better measurement and estimate my measurement errors with standard deviations. Here are the resulting filter flows:
- Cafec: 5.79 ± 0.03 mL/sec
- Hario tabless: 6.89 ± 0.05 mL/sec
- Hario tabbed: 11.03 ± 0.02 mL/sec
- Hario unbleached: 15.3 ± 0.1 mL/sec
- V60 Cloth: 18.1 ± 0.3 mL/sec
- Osaka metal: 67.8 ± 0.6 mL/sec
- Chemex bleached: 7.23 ± 0.02 mL/sec
- Chemex unbleached: 9.82 ± 0.02 mL/sec
The detailed data are available here. Keep in mind that flow can be affected by water viscosity, your grind size, filter clogging, etc.; so these values are most interesting when compared to each other in a relative sense. The error bars are mostly due to my ability to start and stop the timer at the right time; my standard deviation on timings across all filters was 0.2 seconds, and apparently the average human reflex delay is 0.25 seconds, so it seems credible that the reflex inconsistency be of that same order of magnitude.
Now let’s compare the idealized versus predicted flow rates, and see if they correlate well:

If the idealized flow rates were perfect, all filters would fall along a straight line in this figure. As you can see, it is not the case at all; it seems that filters made of different materials or with different creping behave differently. I think this is due in part to how they adhere to the walls of the V60, but I think that creping inside the filter may also contribute to slow down flow because water will prefer to flow mostly along the crepe valleys instead of everywhere on the filter surface. If that’s true, then filters smoothed on the inside would be preferable, as they would promote a more uniform flow across the filter surface. I won’t be able to determine whether that’s true or not with any more certainty in this post.
Another hypothesis I had is that the pores of paper filters may be better represented by diagonal tubes instead of straight up ones, in which case the “effective” thickness of the filter would always be a factor larger than their true thickness. While this may be true, I observed no clear correlation between filter thickness and how offset the idealized flow rate was from the real flow rate; this indicates that this effect is not the biggest cause for these differences.
The Tainting Effect of Filters
Another often discussed factor about coffee filters is how they might directly affect the taste of a coffee beverage by contributing chemical compounds to the coffee beverage. This is what can produce this undesirable papery or cardboard taste, and is often the quoted reason for why pour over filters need to be rinsed before brewing. To be sure, there are other reasons to do it; pre-heating the brewing vessel and making sure the filter is well positioned in it are also important reasons why we pre-rinse pour over filters.
I once did a preliminary experiment where I pre-rinsed Hario tabless and tabbed filters (both are bleached) and then immersed them in hot water for a few minutes, and tasted the water. I was not able to confidently say that I could taste anything different from just the tap water, so I concluded that I could use either of them without worrying about taste, at least if I pre-rinsed them.
But there is a more objective way to compare how much each different filter can taint your coffee beverage, with distilled water and an electric conductivity (EC) meter that measures total dissolved solids (TDS) in water. I decided to measure those by emulating a water temperature, contact time and water weight that are similar to typical brewing conditions. I put the dry filter in the Hario switch pour over device, turned off the flow, and poured 200.0g of distilled water (1 ppm) in the device, weighed with a 0.1g-precise brewing scale. I didn’t use more than 200g to avoid over-filling it. I then immediately put a cork lid on top of it for heat insulation, and waited 3 minutes before I turned on the flow switch.
I then placed the water in a small ceramic cup, which I covered with a plastic lid to stop evaporation. I waited a few hours until the samples came close to room temperature (I measured them at 27°C, and the room temperature was 25°C). I decided 27°C was ok because the TDS measurements had stopped changing between 40°C and 27°C, and waiting for the samples to cool more would have taken hours more still. The EC meter that I used applies a temperature correction, but it is not perfect so it’s best to remain within a few degrees of 25°C to get absolute TDS measurements. I made sure that all samples were measured exactly at the same temperature (27°C). To these measurements, I subtracted the 1 ppm solids that were already there in my distilled water. Here’s what I obtained:
- Hario tabbed bleached: 0 ppm
- Hario tabless bleached: 0 ppm
- Cafec bleached: 1 ppm
- Hario unbleached: 5 ppm
As you can see, bleaching actually does what it’s supposed to do, but for some reason, the Cafec filters seem to still have a small amount of dissolvable compounds left in them. These measurements are consistent with my being unable to taste any effect of the bleached filters in a water immersion, especially given that I had also pre-rinsed them. This also seems to lend credence to Scott Rao who didn’t pre-rinse the Aeropress or Whatman filters that he places on top of his high-extraction espresso pucks.
This all seems like a cautionary tale against using unbleached filters, but what I was testing here is the inherent ability of these filters to taint your coffee beverage if you don’t pre-rinse them. As I mentioned before, tainting is not the only reason we pre-rinse pour over filters, so I would certainly not recommend you stop pre-rinsing bleached filters, but there are scenarios like an upper espresso puck filter where pre-rinsing might not matter. Now what would be even more interesting to me is to ask a more practically applicable question: what happens to these numbers if we pre-rinse the filters ? And how much do we need to pre-rinse them ?
To answer these questions, I carried a different experiment that resembles two of the filter rinsing techniques that I used, applied to the Hario unbleached filters as a worst case scenario. The goal of these experiments was to see whether I can detect any additional dissolved solids imparted by the filter.
The first rinsing technique that I most often use is to first pre-rinse with cold tap water, because brew water is a bit more precious. I then pour a little bit of hot brew water to preheat the vessel, which is probably not that important as I use the plastic V60, but also to replace water suspended in the filter with my brew water that has the desired alkaline buffer. This is probably a bit overkill as the amount of retained water is small, but it’s an easy thing to do.
For the first experiment, I therefore used room-temperature distilled water (1 ppm) with the Hario switch, but this time I left the flow switch open. I poured three pulses of approximately 50 grams of water into three distinct cups, and then a final pulse of hot distilled water in a small ceramic container. I covered the ceramic container with a plastic lid and let it cool down to room temperature, so that I would get a more accurate TDS reading with the EC meter. Here’s what I obtained, after subtracting the initial 1 ppm to every measurement:
First pour (dry filter): Poured 50.3 g water, resulted in 5 ppm TDS in 47 g output, i.e. 3.3 g water was retained by the filter and 0.235 mg of filter material was dissolved.
Second pour: Poured 49.7 g water, resulted in 3 ppm TDS in 48.5 g output, i.e. 1.2 g water was retained and 0.146 mg of filter material was dissolved.
Third pour: Poured 49.9 g water, resulted in 1 ppm TDS in 49.6 g output, i.e. 0.3 g water was retained and 0.050 mg of filter material was dissolved.
Fourth pour (hot water): Poured 49.8 g hot water, resulted in 1 ppm TDS in 49.8 g output, i.e. no water was retained and 0.050 mg of filter material was dissolved.
This indicates that tap water removed most of the filter materials, but switching to hot water allowed to extract a tiny bit more, although I would be skeptical that 1 ppm of filter materials could be humanly tasted. It also seems that the filter was able to retain a total of 4.8 g water and contribute 0.481 mg of paper material.
For the second experiment, I used a similar method but used only hot water, and used 100 grams for my initial pour because I knew 50 grams would not be enough to remove all filter solids.
First pour (dry filter): Poured 100.0 g hot water, resulted in 10 ppm TDS in 95.8 g output, i.e. 4.2 g water was retained and 0.958 mg of filter material was dissolved.
Second pour: Poured 49.6 g hot water, resulted in 6 ppm TDS in 48.8 g output, i.e. 0.6 g water was retained and 0.293 mg of filter material was dissolved.
Third pour: Poured 49.3 g hot water, resulted in 0 ppm TDS in 48.5 g output, i.e. 0.8 g water was retained and no detectable filter material was dissolved.
In this case, it seems clear that 150g of hot rinsing water was enough to deplete the filter of all dissolvable materials. The filter seems to have retained a total of 5.6 grams of water, which is a bit more than the previous one. I don’t think this is due to the water being hot, but probably to how fast I moved the V60 when I picked it up. In this case, a total of 1.251 mg of filter material was dissolved, more than double what was dissolved in the first experiment. It’s therefore preferable to rinse unbleached filters with hot water, otherwise you’ll likely need a large amount of water. This is not true of any bleached filters; as you may recall, even the first pulses of water contained no dissolved solids.
Uniformity Index
One filter property that I expect could help achieve a uniform pour over extraction is how consistent the flow is across the surface of the filter. If pores are grouped in some regions of the filter, this will contribute to channeling, i.e. water will take preferential paths across your coffee bed and won’t extract in a very uniform way. To estimate this effect on the various filters I investigated, I calculated the total idealized flow in each microscope image that I took for a given filter and looked at the standard deviation of these values for any given filter. If a filter always seems to have a similar flow regardless of the position where I placed the microscope, that is a great thing, and it means that channeling should be minimized.
I defined the uniformity index (UI) simply as the inverse of the standard deviation of unit-less idealized flow across filter regions; this way, a higher UI corresponds to a more uniform filter. I did not assign any physical units to this index because it would require specifying the water viscosity, pressure drop across the coffee bed, etc. Hence, this index is only useful as a relative measure between filters, and it could not be compared with those calculated from any other pore detection algorithm or microscope. Here are the UI I calculated for all filters under consideration:
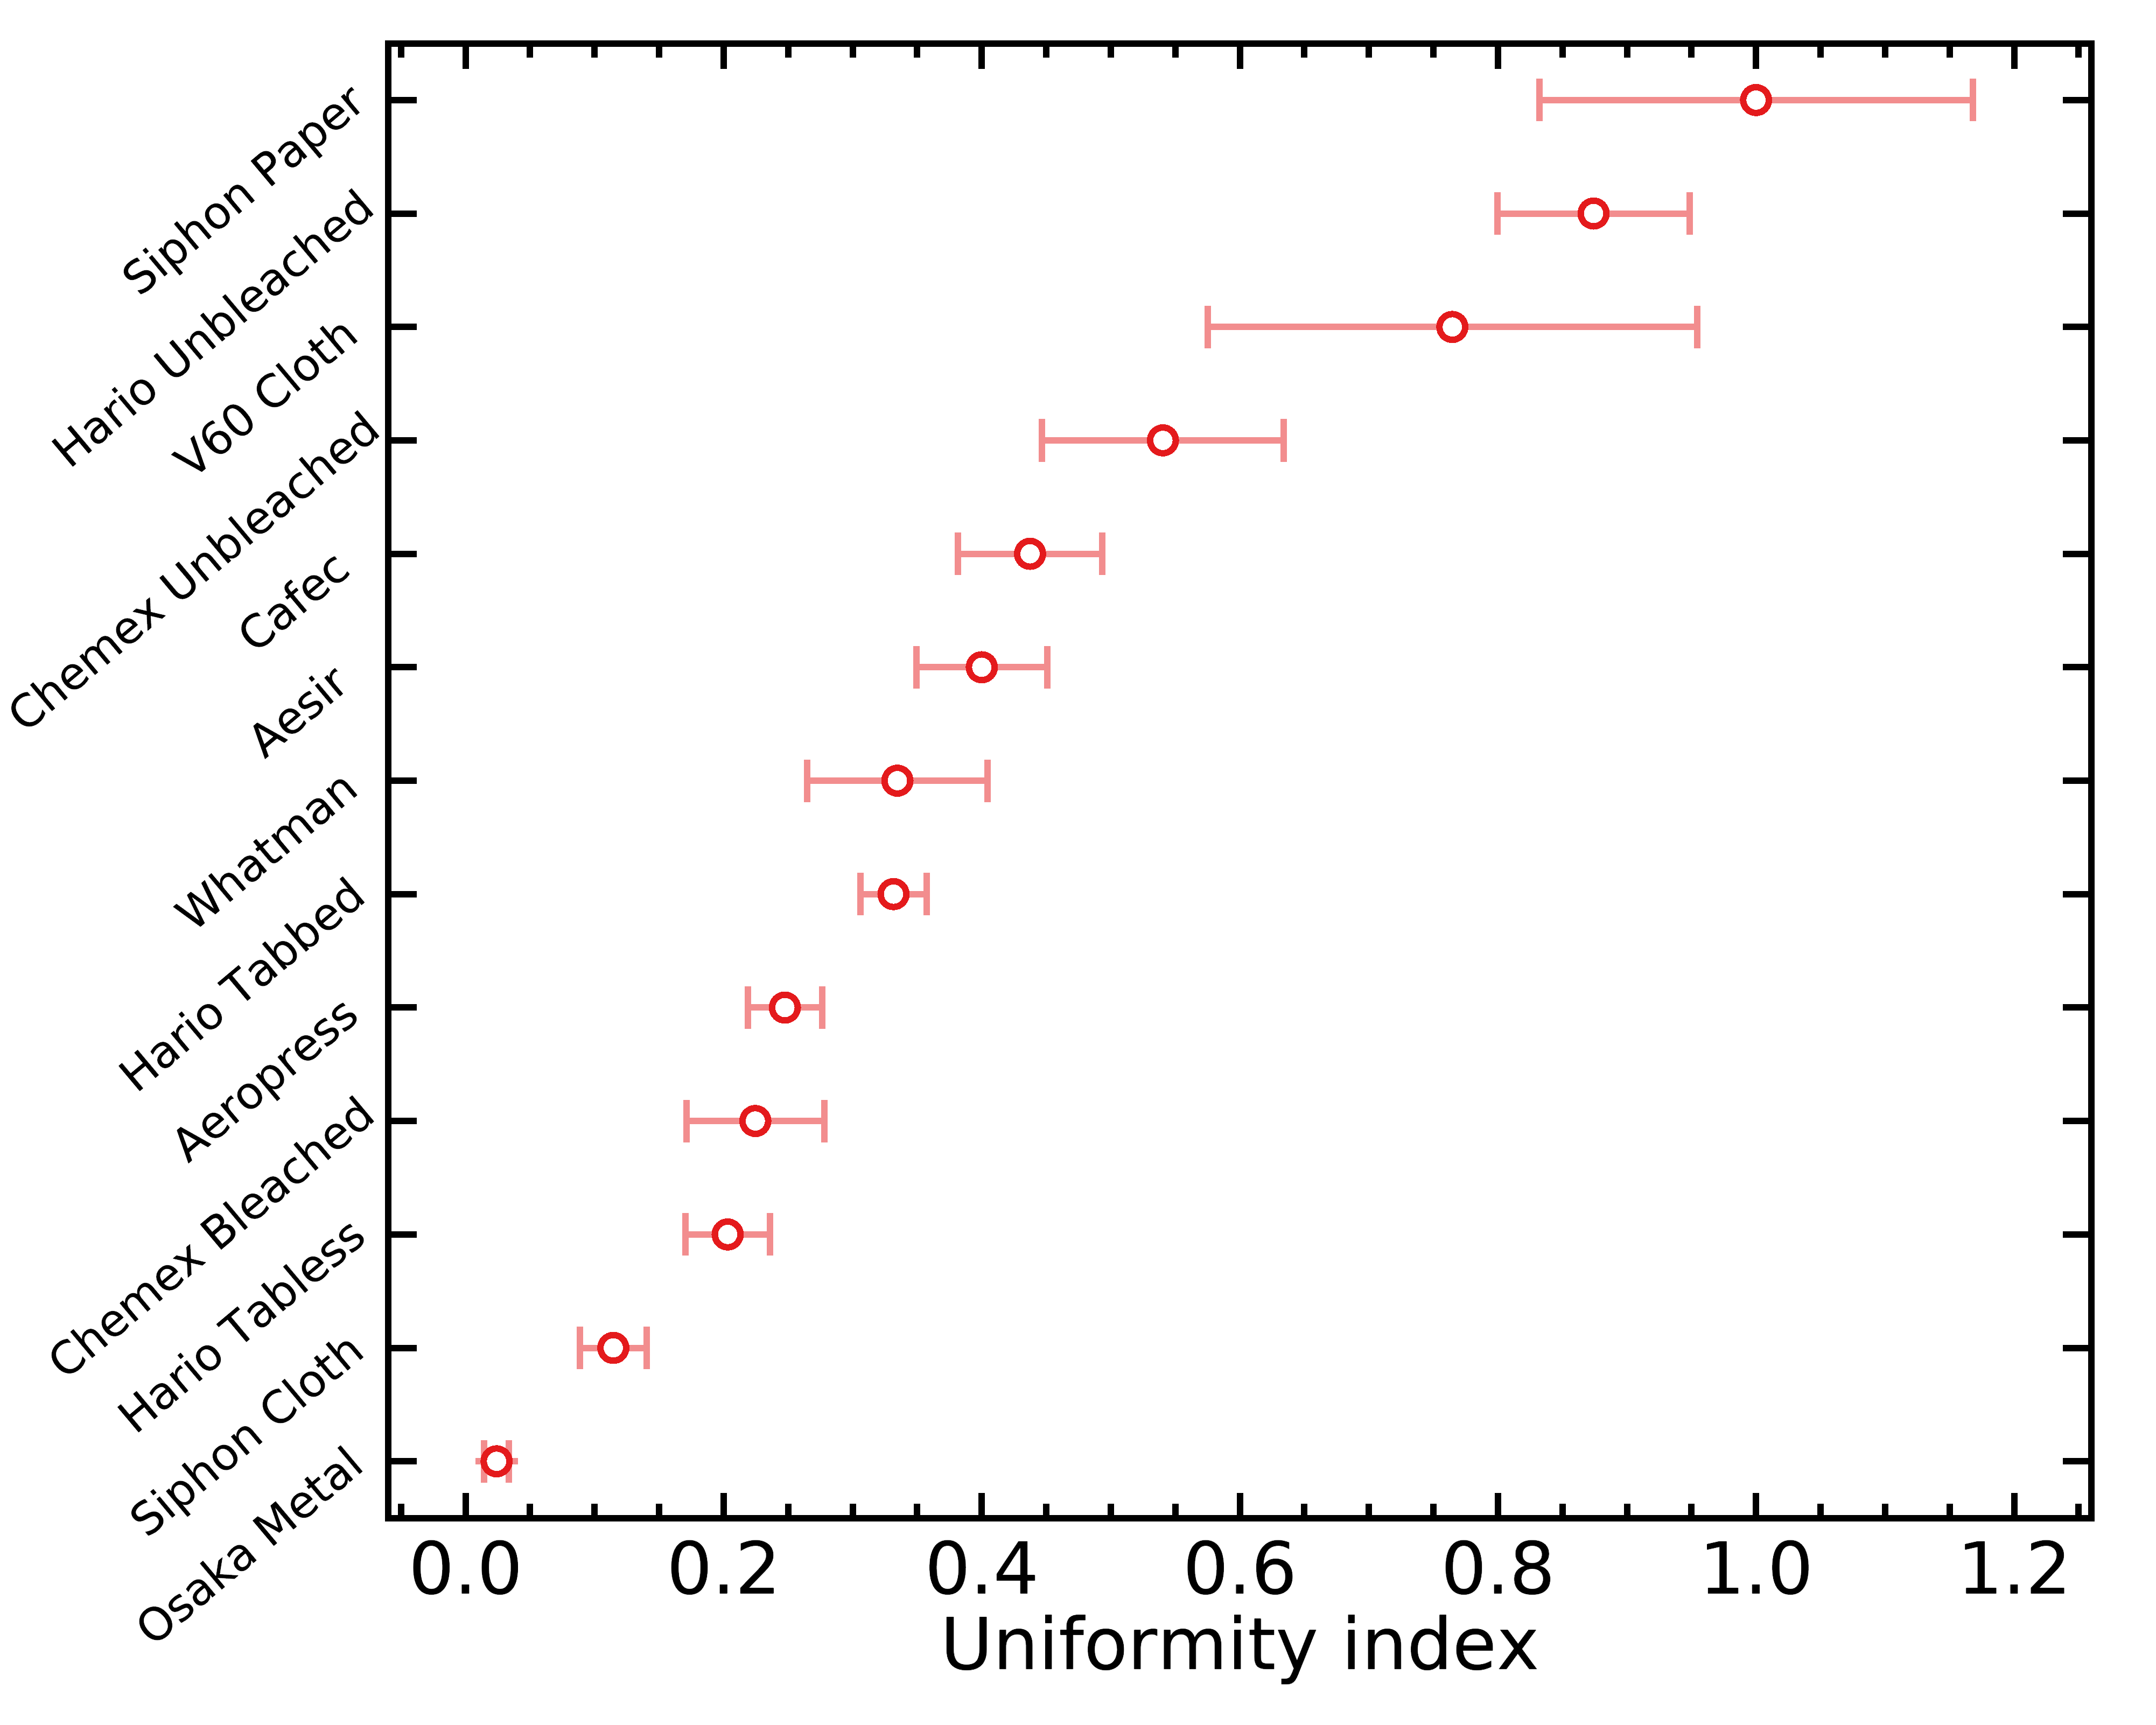
The error bars above are based on small number statistics. Remember that a higher UI is good; it means the filter will flow more uniformly across its surface. Notice how the unbleached filters come out at the top again !
As I already mentioned, I suspect that filters with a higher UI may produce a more uniform extraction, maybe even more so if you use small doses in your pour overs. However, what I do not know is the observable importance of this effect; the effect could be too small to matter in practice. This however opens up interesting practical experiments; for example, it seems possible that the Hario unbleached paper filters may allow us to reach more even extractions, and that would result in a higher average extraction yield when everything else is kept fixed.
Filter Clogging Index
A typical problem that one can encounter when brewing coffee is a sudden decrease in flow rate caused by very fine coffee particles clogging the pores of a filter. For this reason, the values of flow rate that I measured above must be taken with a grain of salt: if a filter flows very fast because it has very large pores, coffee fines might be able to clog them, and as a result the filter flow rate might decrease heavily during a brew, and depend strongly on your brew method (e.g. the volume of your bloom phase, whether you stir the slurry or not, etc.). If the filter flows fast because it is thin, the decrease in flow rate might be less important, and less sensitive to your technique.
It is possible to calculate a clogging index in an objective way, by calculating the overlap between the pore size distribution of a filter and the particle size distribution of a grinder. Obviously, different grinders (and different grind settings) will produce different amounts of fines, but using any reference grinder will provide a valuable relative assessment of how each filter is sensitive or not to clogging. The resulting clogging index will therefore be most important to consult when using a grinder that produces a larger amount of fines – in my experience, you generally get more fines with smaller burrs, conical burrs, or anything that can widen the full particle size distribution like misaligned burrs.
Not everyone seem to prefer grinders that produce the lowest possible amount of fines (so far, it seems to be my preference), but whatever your preference is, you should always try to avoid filter clogging. A filter will typically not clog in a uniform and immediate way, and that means you will get channeling as water starts to follow some preferential paths along the un-clogged filter pores. As you might already know, channelling will over-extract coffee along the channel paths, and cause astringency (a dry feeling in the mouth) in the resulting brew. Therefore, if you use a grinder that produces more fines, you should consider using filters that have smaller clogging indices. On the other hand, if you use a grinder that produces very little fines, this might be less important.
You might be aware that I wrote an app to measure particle size distributions, but I never used it in combination with a microscope, and without this it won’t be possible to use it to build a particle size distribution down to particle sizes as small as filter pores. In the future I will experiment with this, but for now I opted to use a laser diffraction particle size distribution instead. This distribution was generously sent to me by John Buckman and Scott Rao, who brought a sample of the Weber Workshops EG-1 (version 1) grinder with stock burrs to a laser diffraction device:

I used the web plot digitizer to extract data from that photo, and I calculated the clogging index of each filter by performing the following operation:

where f(x) is the pore size distribution of the filter and p(x) is the laser diffraction particle size distribution of the EG-1. The numerator includes a reversed cumulative density function of the pore size distribution because a coffee particle can contribute to clog any filter pore that is the same size or larger. Technically, the closest thing I’d know how to call this operation is the integrated product of a cumulative density function with a probability distribution function; it’s not a convolution.
If this looked like alien symbols and sounded like gibberish to you, that’s totally fine. Here’s what it comes down to: the clogging index is an estimation of the average fraction of flow that can be clogged by coffee particles smaller than 200 micron in diameter (100 micron in radius). If CI = 90%, it means that the average coffee fine smaller than 200 micron would be able to block pores that contribute 90% of the flow rate for a given filter, if you use enough coffee and agitate it enough. It does not correspond to the true fraction of flow that will be blocked by clogging, because that would depend on how much coffee you use and how large your filter surface is; some fines may be small enough to block 90% of the filter flow, but if they are not present in large enough numbers to block all the pores, or don’t ever come in contact with the pores, then that won’t happen. I don’t want to attempt to make these numbers representative of the true fraction of blocked flow, because not only it would become overly complicated, but it would also not be accurate because coffee filters are not idealized flat planes with circular holes. These numbers are however very useful to compare filters in a relative sense, to understand which filters might clog more easily than others.
Here are the CI I obtained for all filters tested here:

Remember that a small CI is good, as it means your filter is less sensitive to clogging. The trend of unbleached filters coming up as the superior ones seems to hold yet again !
Final Recommendations
I know this post contains a massive amount of information, so I’d like to distill some of what I learned into practical recommendations. Please keep in mind that those are based on limited experiments, which comes with its caveats: for example, it is possible that wetting the filters affects the pore size distribution, and it is possible that the more even pores across the filter surface only affects channeling in a very small layer of the coffee bed. Therefore the recommendations below should not be taken as an absolute truth, but rather as a guide for what seems most worth exploring with your next V60 experiments.
Metal Filters in General
Metal filters suffer from a major problem in my opinion: the pores are typically so large that the flow is only constrained by the grind size, and that will force you to grind very fine in order to obtain practical brew times. But this also means that a lot of fines will pass through the metal filter. Metal filters are also different from paper filters because they don’t filter with mazes of spacings between paper fibers, but rather just straight, large holes through an otherwise very uniform and flat filter. Therefore, metal filters won’t clog, and any fines small enough to penetrate the pores will end up directly in your beverage. This means metal filters won’t produce very clear brews like other pour over filters, instead they will produce a beverage with suspended solids and fines, with less clarity and more body. Personally, I’m not a fan of this.
Cloth Filters in General
Cloth filters suffer from a similar problem to the metal filters in terms of flow rate and large pores. However, they are in my opinion much worse because they are a hassle to properly clean and re-use. I wrote a lot more about this in my post about a high extraction yield siphon recipe, and I’d encourage you to read it if you want more information about proper management of cloth filters, but I just gave up on using them.
Paper Filters for Pour Over
Paper filters are much more interesting to me, as their smaller pores allow to prevent coffee fines from passing into the beverage. The coffee bed does a lot of the job at retaining coffee fines, but if the filter had larger pores, some of them (either those already at the bottom or those that migrated down) would still pass through.
One big take away point that I got from this analysis is that bleaching seems to deteriorate the quality of pore distributions. This is true in terms of the general spread in pore sizes, but even also in how much the flow of water varies across the surface of the filter.
This was surprising to me, as my initial bias was to disregard unbleached filters because of their tainting potential. But as we also saw above, it seems possible to remove all dissolvable solids with an adequate pre-rinse using 150 grams of boiling water.
I have not yet accumulated any practical evidence for this, but I suspect that using unbleached filters might both reduce channeling in all situations (because flow is more uniform across the filter surface) and make your brew more robust against clogging (because of the smaller number of large pores), all while having a slightly faster flow rate (because there are more pores per unit surface) !
The same conclusions hold for chemex, although their much larger filters almost certainly require more water during pre-rinse. I haven’t done this experiment, but based on their weight differences (5.4 g for Chemex and 1.4 g for Hario), I would recommend using about 4 times more rinse water.
Another result that surprised me was how the Hario tabless filters seem to be worse than the Hario tabbed filters on all metrics; they flow more slowly, have less uniform pores and are more susceptible to clogging compared to the tabbed filters.
The Cafec filters show all signs of being a weird case of filters that are bleached more gently; both their pore distribution quality and ability to taint water is in between the bleached and unbleached cases. If you are really afraid of paper taste or hate using a lot of water to pre-rinse your filter, they might be the optimal solution for you, but keep in mind that they flow much slower than other paper filters.
All of these conclusions can be visualized in the figure below, where I placed all paper pour over filters on a graph of clogging index versus flow rate; filters further toward the right are more easy to clog, and those toward the top flow faster. I also used larger symbols for the filters that have a more uniform flow across the filter surface, which means that larger symbols should be less susceptible to channeling regardless of your brew technique.

Aeropress Filters
For Aeropress, we really only have two contenders here, as I doubt people will start ordering and cutting Whatman filters for their Aeropress brews. But even if you had the motivation to do so, it seems that the Aesir filters come out at the top in terms of their robustness against both channeling and clogging. They do seem to flow slower however, because they are almost twice as thick compared to the standard Aeropress filters; they have more pores per surface area than Aeropress, but probably not enough to make up for their thickness. However, remember that an Aeropress brews have another variable that is not accessible to pour over; you can press harder, and make up for that difference.
It seems to me that Aesir filters are therefore more desirable for Aeropress brews, which did match my very limited and subjective experience.
What does a Clogged Filter Look Like ?
I decided to also try something fun with the microscope, and imaged a clogged and dried V60 Hario tabless paper filter:

We can clearly see that pores are stained with a brown color, perhaps caused by coffee oil, but we cannot see obvious fines blocking the entrance of a pore. That isn’t too surprising, as we might expect clogging to happen a little deeper than the filter surface.
I hope you enjoyed this post ! It is definitely the one that required by far the largest amount of work yet, but I think it was worth it.
Acknowledgements
I’d like to give a special thanks to Alex Levitt for sending me Cafec filters, and Scott Rao for giving me Chemex bleached filters, and for useful discussions without which I would not have thought about the possible importance of the uniformity index. I would also like to thank Doug Weber for useful comments.

Wonderful, thank you! So much in here that is useful & so much to be explored
LikeLiked by 1 person
Impressive science, Jonathan!
Here’s a question I fear is stupid: How can the presence or absence of a tab on a paper filter make any difference?
Best,
LOUIS
LikeLiked by 1 person
I don’t think the tab makes any difference, they just have other properties that differ like thickness and creping
LikeLike
Thanks.
Another question, please: I think you wrote that the tabbed Harios drained faster than the untabbed. Yet I think the initial complaints about the tabbed is that they ADDED brewing time. Am I right?
LikeLike
that was the complaint. It might be different with/without coffee from clogging
LikeLike
Dear Jonathan,
Reading your article more carefully I answered my own “stupid” question: Hario tabbed filters are thinner than untabbed filters. Right?
Louis
LikeLike
Dear Jonathan, i have highlighted some things that I probably do not understand because of my poor English i think. 1. You Wrote that if pores are grouped in some areas of the filter, this will contribute to Channeling. Looking at the microscope in the photos above it seems to me that this is the case with the tabbed filter, 2. if a filter flows very fast because it has very large pores, coffee fines might be able to clog them. It also seems to me in the above pictures again that tabbed filters have larger pores. Great work as always. Thanks!
LikeLike
Yeah I put one of the worst images for the tabbed Hario without realizing; the analysis is based on many images for each filter. But also, I defined uniformity as how much total flow varies from one image to the other, not how much it varies within an image. So I am looking at flow variations on the ~millimeter scale, not the micron scale. I think ~mm scale variations are more important because I think they will cause channeling in a deeper layer, but that’s just my intuition. It could be useful to look at spatial uniformity on many scales.
LikeLike
For the size of pores I think our eyes aren’t good enough to make such small differences apart
LikeLike
That’s one of the differences yes
LikeLike
But they’re produced in different factories altogether so there might be many more differences
LikeLike
So, tabless filters logically have bigger pores and maybe more pores than tabbed ones?
LikeLike
The tabbed filters have slightly more “big pores” (in the 40-60 micron range) and slightly more total pore area, they’re also thinner, compared to tabless
LikeLike
Also have you done these experiments with water? why with coffee, do we have the opposite effects? that is, the tabless filters are faster and the tabbed filters are the ones that clogged the most? (knowing that there are many factors with coffee)
LikeLiked by 1 person
Could be clogging. I did it with just water to compare with my imaging analysis of pores
LikeLike
And since tabbeds have bigger pores, shouldn’t they clogging easier?
LikeLike
That’s why I specified “in the 40-60 micron range” because tabless have slightly more above 60 micron which would theoretically make them clog more. But the thickness might also play a role, maybe tabless are able to accept more fines because they are thicker. We’ll see when I do the experiment
LikeLike
Looking forward. Thanks for the answers!
LikeLiked by 1 person
Great work, and exhaustive at that! A great resource to come.
I may have missed or glossed over it, but all the data is based on the pore distribution of unrinsed/dry filters, yes? Would it not therefore be an idea to measure again after a prerinse? As this is both what everyone does before a brew and it may have an effect on this pore structure? You probably answered it somehow in a formula though! Again, fantastic work.
LikeLike
Thanks Mike ! That’s right I did everything dry for practical reasons, but I’ll try with wet filters too 🙂 someone else pointed that out a few weeks ago when I released it on Patreon
LikeLike
Hi, excellent work as always! I am not sure which unbleached v60 filters you!ve been testing, cos here in the link are the 100 ones in plastic but on Instagram you are saying that you have the carton boxed with 40 pieces. And they sell also 100s in the box. So which ones were you testing: VCF-02-100M, VCF-02-100MK, or VCF-02-40M?
LikeLike
On IG I was talking about the bleached tabless filters, VCF-02-40W. For the unbleached I don’t have the box anymore so I’m not sure about the code, but they are tabbed.
LikeLike
VCF-02-100M are the only ones that have tabbed so I’d say that’s what I have
LikeLike
Amazing experiments and very informative discussion and results.
Anyone who loves making coffee and likes to experiment should read and understand this study.
Well done mate…
LikeLiked by 1 person
Thanks !
LikeLike
With respect you are confusing elements of my post. I was just saying that the best method I have found for making coffee is a 19 bar espresso machine, they give a good brew (plus crema if required) for a relatively small quantity of ground coffee – and obviously there are no filter papers involved.
Now moving on… Paper filters usually sit in a cone or similar device, are we agreed on that? Now, we find that when we remove the paper filter, it often collapses and splits open along the seam where the paper has been joined together. This is because there can be anything up to 20 or 30 grams of water-logged coffee grinds – and this weight causes the paper to split, so the coffee grounds fall out everywhere and make a mess. I cannot be any clearer to explain what I mean.
LikeLike
Ok, it’s clearer now. That hasn’t been my experience at all. I pick up the filters with 3 points of contact (2 hands) after brewing to avoid making a mess, I never had one tearing up yet over 500+ brews.
LikeLike
Wow… you spent a lot of time and effort on this project, but what is the take home message? I have tested numerous paper filters and in my opinion they are all useless. If grinds are too fine, they quickly clog the paper and then you have to wait ages to get your cup/mug filled – and of course the coffee is now cold – not good! If the coffee is too coarse, then you get a better flow rate, but you need to use twice as much coffee to achieve a good strength of brew. Also, nearly all paper filters we tested split open as soon as they get wet! That is why the best and fastest method is a pressure machine (19 bars) or an aeropress type portable device.
LikeLike
Wow under such pressure I’m sure most paper filters are useless. What machine are you using exactly ? That sounds super interesting. There are a few take home messages; (1) it’s unclear that Hario tabless are better like almost everyone says; (2) unbleached might be better in terms of flow and ability to not clog if we can get rid of the papery taste, and others that I forget. I’m working on a second post about filters where I test these differences in practice. I did all of this mostly out of curiosity, and for fun, so it didn’t seem like that much of an effort 😉 that’s usually how I like to relax after 1 AM.
LikeLike
I don’t understand your link between 19 bar pressure espresso machines and the drip filter method. I didn’t infer that anyone would use paper filters under pressure – that would be madness! Our tests using paper filters never produced a 100% success rate because the paper tends to split along the seam. This is a basic design flaw that consumers cannot even understand it seems. Paper filters should NOT have a seam – they should be made from one piece of material with no seam then they won’t split. This is not rocket science.
LikeLike
Have you verified that the seam causes an issue ? If so I’d be curious to know how; it’s possible that it causes bypass water along the seam and outside the filter. I thought you used paper filters under pressure because you mentioned that the filters kept tearing; I’m not sure I understand why they tore when you brewed under normal V60 conditions ? Also, I thought you were saying that you were brewing filter coffee at 19 bars – you’re talking about espresso not filter ?
LikeLiked by 1 person
It is easy to see where the seam is on a paper cone shaped filter. The filters are usually made from 2 pieces ‘welded’ together – and this is the weak point. When we lift the filter out from the supporting plastic cone, the weight of the hot wet coffee grounds burst open the now wet paper at the seam which is the weak spot. We have experienced this problem testing dozens of different paper filters. With an aeropress type machine, the filter paper is flat with no seams. Can you please understand my point?
LikeLike
Yeah I already understand your point. I’m saying that I never experienced what you’re describing in hundreds of brews ¯\_(ツ)_/¯
LikeLike
Thanks so much for this exhaustive study. We all really appreciate how much effort you put in to do this, and your process was very meticulous. This is Eldric, by way, the owner of Aubade Coffee who produce the Aesir Filters for Aeropress.
LikeLike
Nice, thank you !
LikeLike
Hahaha this is great, thank you for posting your results.It seems however that all the unbleached filters by Hario are tabbed.
LikeLike
Never mind as re-reading the conclusion it seems the tabbed are preferable, though it seemed the other way from looking at the clogging index on the chart.
LikeLike
That’s right, however it seems that my clogging index does not track experimental results very well so far, my suspicion is that thicker filters allow to limit clogging much more than uniform pores do. I’m still preparing a part 2 post about practical effects, and I think that the Hario tabless are usually better because they clog less.
LikeLike
Hey Jonathan, has your opinion on tab vs tabless changed in the past few months? What’s your latest and greatest reco for which ones to get?
LikeLike
Hey Steve, I haven’t done a lot more brewing with the tabbed filters, so I still prefer the tabless ones ! I did take more microscope/flow data on filters, and the tabless ones still seem preferrable.
LikeLiked by 1 person
In case you haven’t seen the James Hoffman’s review of tabbed and untabbed
http://www.youtube.com/watch?v=0uggibTY0AE
LikeLike
Wonderful exploration Jonathan. Thank you.
Is there a way for you to add a Kalita wave filter to the equation?
LikeLike
Yeah sure, there’s several filters I should add !
LikeLike
the real question — in this time of pandemic, is there any utility for coffee filters in DIY mask making? e.g. this Cambridge study that shows what materials can be used to effectively make DIY masks out of things like vacuum bags? https://twitter.com/jeremyphoward/status/1242894394396729344?s=20
LikeLike
Haha it could work, as long as they don’t break down. I don’t know for sure though, so please don’t blindly rely on coffee filters for that !
LikeLike
Jonathan, I have never used Cafec coffee filters. However, I see on their website (https://cafec-jp.com/products/filterpaper/) they have in depth information and multiple filters with different characteristics to choose from. It looks like the bleached Cafec filter you used is the AC4-100W made from Abaca. There is also the CC4-100W which is made from traditional paper. Both appear to be their “generic” filters. However, Cafec has some other V60 filters, some of which are actually tailored for specific roasts. Have you looked into or tried any of their special filters? LC1-100W, MC1-100, or DC1-100? I hope to purchase perhaps the light or medium roast filter and see what happens!
LikeLike
Hey, I have not tried any of those yet, no !
LikeLike
This is amazing, thank you so much for sharing this!
I recently bought some unbleached hario filters, mainly because I ran out, and they were the only ones I happened to find that day. With the unbleached filters, my brews (30g coffee, 500g water) have been draining about a minute faster (around 2:30ish as opposed to the normal 3:30ish). So reading this post makes it all make sense! It’s cool to see that your experiments matched up with what I was experiencing myself.
So, since unbleached filters reduce channeling and allow for a faster flow rate, what recommendations/ideas do you have on adjusting my brew recipe to these filters? Any thoughts on grind adjustments, longer bloom time, ideal draw down time, etc?
I’m planning on trying finer and finer grind settings to drag out the brew time, so we’ll see how that tastes. Thanks in advance!
LikeLike
Extraordinary writing!! And very much detailed. While I was researching for my article about Chemex Vs Hario V60 Vs Kalita Wave (https://coffeeatoz.com/chemex-vs-v60-vs-kalita-wave/), your article helped me a lot. Keep sharing the good stuff. Wish you all the best
LikeLike
Based on the data here, it looks to me that the hario tabbed filters are the best option here. but based on your latest interview with Scott Rao you said you like the hario tabless filters more. I am a bit confused. Can you elaborate more on this? What filters do you recommend the most based on you experience so far?
LikeLike
The Hario tabbed flow a bit faster but they clog more easily in practice. The clogging index I have measured in the post above does not correlate perfectly with how much filters are prone to clogging in real life. I go deeper into this in my upcoming book 🙂
LikeLike
Hey, Thanks for your incredibly in-depth comparison. I found it fascinating to read. I do use the AESIR filters so it was particularly interesting to see how they compare to the normal Aeropress filters. So thanks for your hard work!
LikeLike
Thank you for the post May I inquire why the water samples from the “Tainting” test were not sent out to a water quality testing laboratory for a full chemical analysis as per e.g. https://www.amazon.com/dp/B01MSTJ1TT Kind Regards Cheerios
LikeLike
Because that was a last-minute idea that I took 5 minutes to try out 😛
LikeLike
Impressive write up here! I see you included a Whatman filter, but as a chemist I know that Whatman have a tremendous line up of filters. It could be fun to see how additional Whatman filters would compare to the Whatman 597 that you included. There are handy guides to help you chose the correct Whatman filter for a given application which you might be aware of already? Which of course leads to an obvious question: If you could chose – what would be the properties of an ideal filter for the various coffee preparations methods available?
LikeLike
Thanks ! Yes, now I’m aware of that big line up. I think Whatman 113 are probably best for filter coffee because they have larger pores and they are thick, which is good for filtration and to prevent clogging.
LikeLike
Thanks for this. Recent awareness of the correlation between cholesterol levels and coffee have resulted in our longtime french press habit being modified with a swift pour thru to filter out the lipids responsible. Looks as if the unbleached cone filters will be the filter of choice. So we are filtered by the bodum filter in the press, the mesh filter in the cone that holds the paper filter in place for the pre drinking pour thru. Be interesting to see how cholesterol levels respond!
LikeLike
Love your physical charaterization methodology. My feeling is that the fiber diameter of the wood pulp and its chemical treatment would be the drivers for the pore swelling that you mentioned.
LikeLike
That sounds plausible yes
LikeLike