Reminder: as an Amazon Associate I earn small commissions from qualifying purchases made through some of the links below.
When reading about coffee roasting, I have often seen bean density being discussed as an important variable that affects how beans will behave during the roasting process. The term bean density is a slightly vague way to refer to its volumetric mass density. One thing I have rarely seen discussed is the green coffee’s surface hardness and how it may affect roasting. In this post, I’ll show that the hardness of different green coffee beans can vary quite a lot, and even seem to vary more than their mass densities across different origins and processing methods.
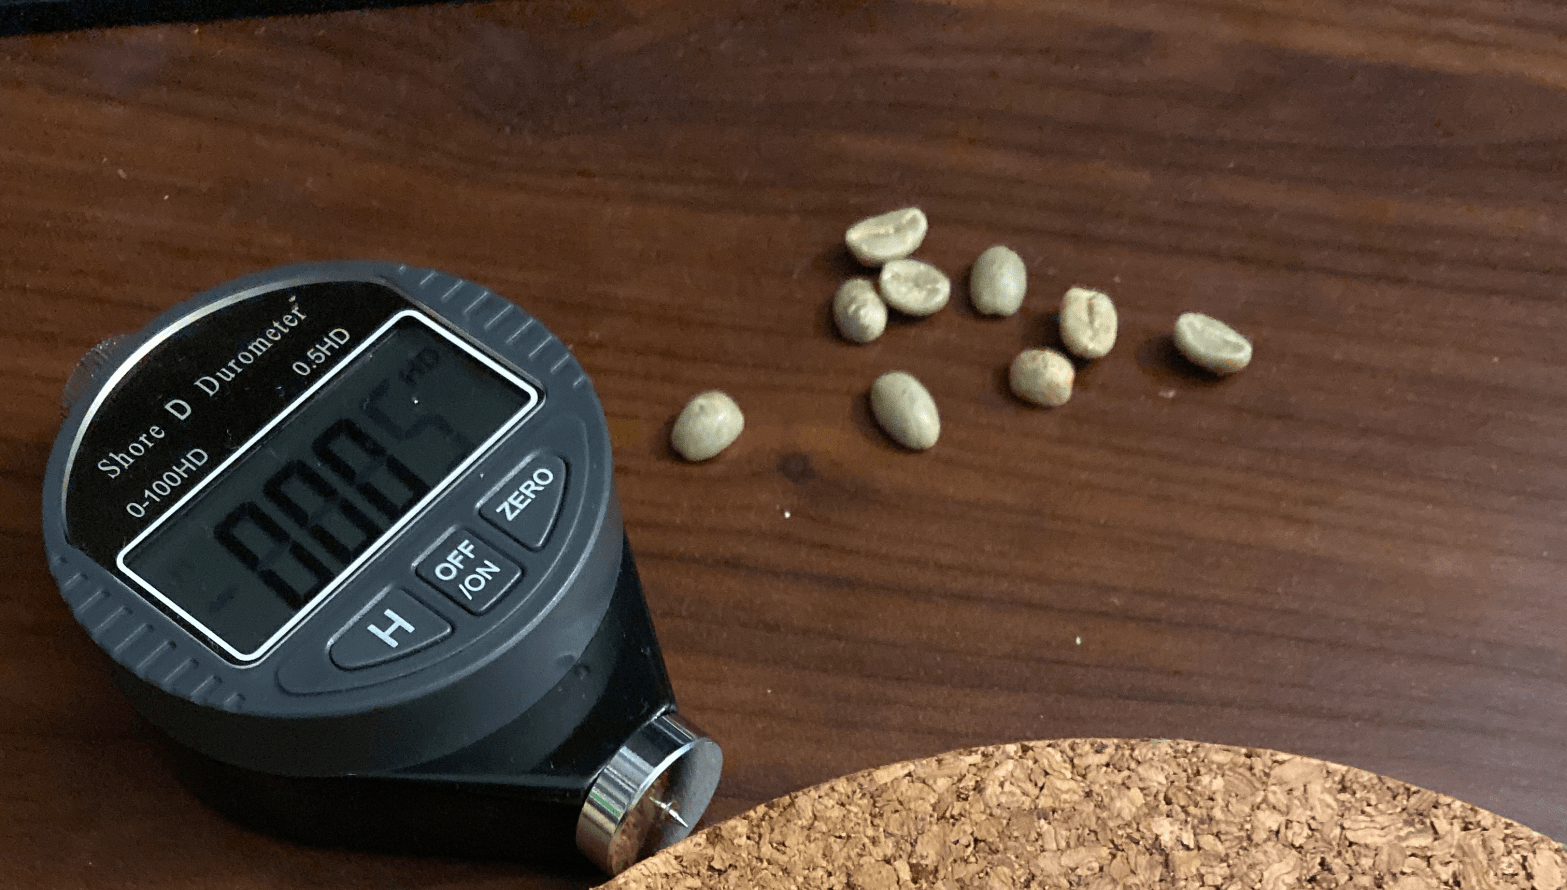
Lately, I obtained a Shore D durometer with the goal to investigate how roasted coffee hardness correlates with pour over drawdown time through the beans’ shattering dynamics when grinding. This is an experiment I’m in the process of completing, but while I was doing this my friend Andy Kires at Canadian Roasting Society generously sent me samples of seven different green coffee beans so that I could try measuring the surface hardness of green coffee directly. So, I decided to compare the hardness and volumetric mass densities of each of these beans. Here are quick descriptions of the seven coffees:
- Washed Colombian
- Natural Colombian
- Washed Ethiopian
- Natural Ethiopian
- Natural Brazilian
- Washed Kenyan
- Ethyl acetate decaffeinated washed Colombian
A more detailed description for each of them is given at the end of this post.
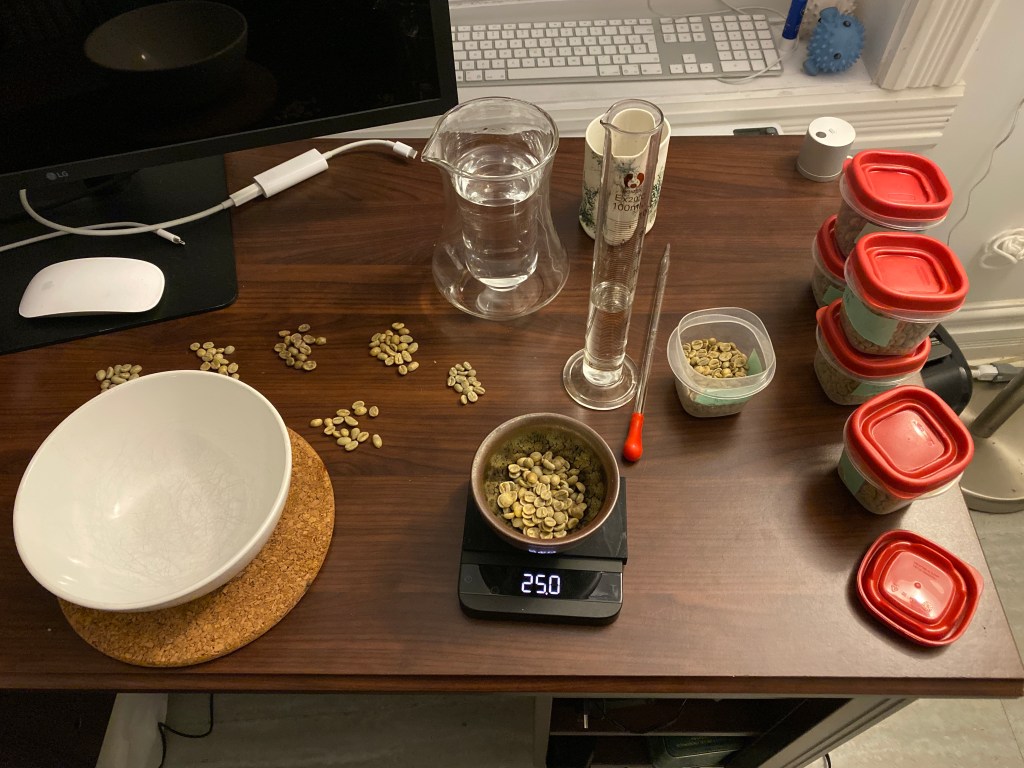
To measure the mass density, I followed this method by Green Farm Coffee where 25.0 grams (let’s call this M) of green coffee is placed in a 100 mL glass graduated cylinder pre-filled with 50 mL of water (this is V1). After gently knocking the graduated cylinder to remove all air bubbles, I measured the new total volume V2 which can be used to determine how much displacement the green coffee caused. The volumetric mass density can then be calculated from this simple equation:
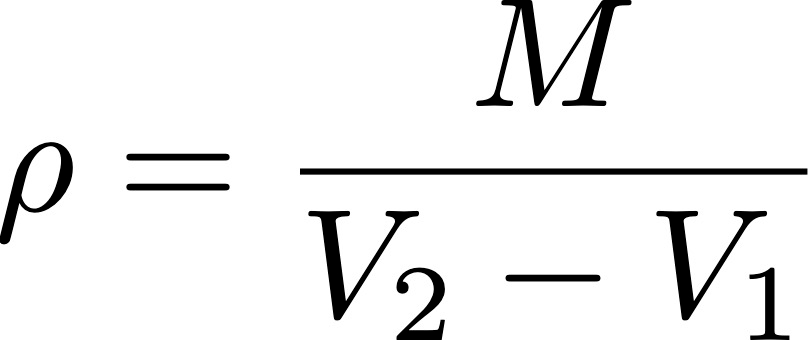
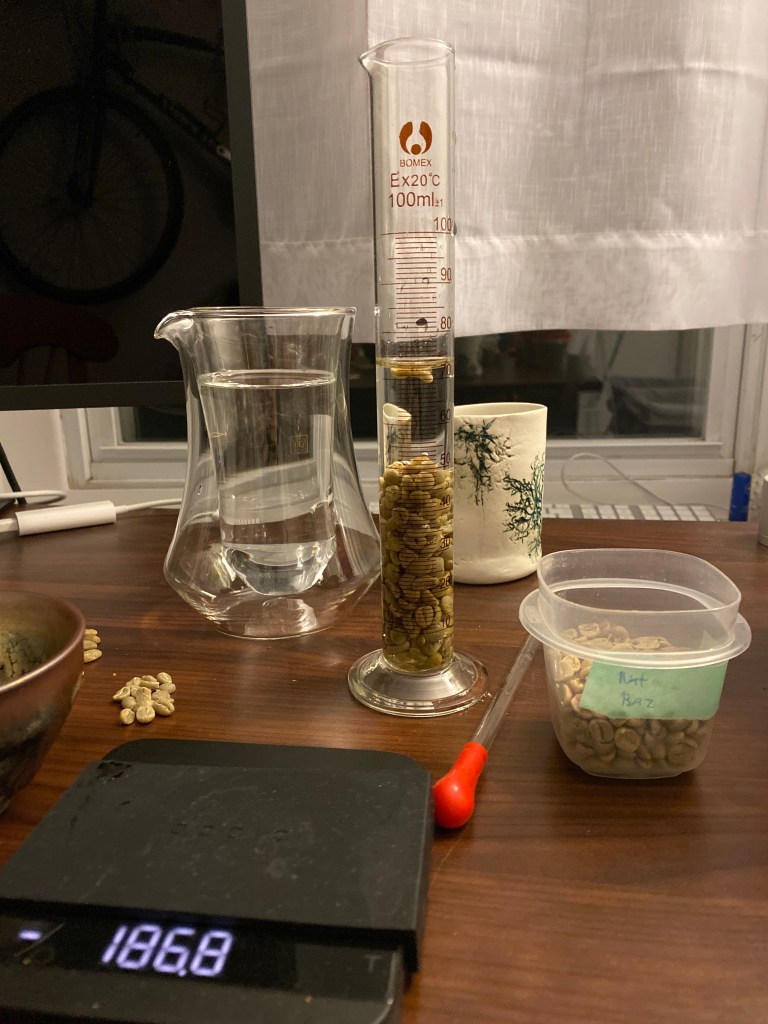
The measurement errors on both volumes were about 0.5 mL as my cylinder is graduated to the mL, and the measurement error on the mass was 0.1 grams given the scale that I used. The results surprised me quite a bit: after knocking out the air bubbles which could seriously alter the results, all coffee beans had almost exactly the same volumetric mass density !

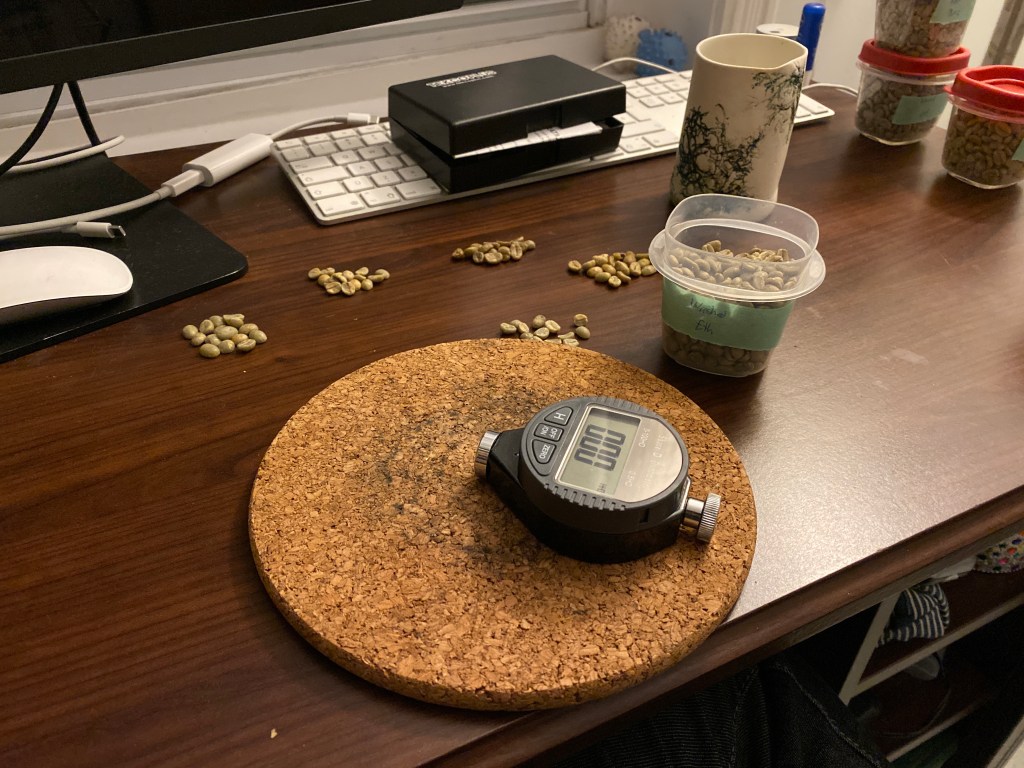
The next step was to measure the surface hardness of the green beans with the durometer. I tried both a Shore A and Shore D durometers, and it turns out that only the Shore D had the correct range to take useful measurements. I placed the green coffee beans on a flat surface, with the flat side of the bean down, and placed the durometer’s needle near the center of the rounded back of the coffee bean. I then pushed straight down on the durometer relatively hard until the measurement stabilized, and noted it down.
As I expected hardness to vary from one bean to the other, or even with the exact needle placement, I repeated this on at least 17 beans for every origin. One could look at the average of these measurements as the most interesting variable, but in these situations I tend to prefer looking at the median because it’s more robust against outlier measurements. The statistics geeks will know that the measurement error on the average is the standard deviation divided by the square root of the number of beans; an analogy can be made for the median, but the median absolute deviation is what must be used instead of the standard deviation. This is very convenient because the median absolute deviation is also more robust against outlier measurements.
Here are the median Shore D measurements I obtained for the seven different green coffees:

The individual raw measurements are available here. The Shore D hardness is a number that goes from 0 to 100 and goes up with hardness.
I still do not know exactly how these will affect roast behavior, but this seems very interesting to me, because we can tell different origins apart much easier than with the volumetric mass density. It might be worth the effort of taking 17 hardness measurements on green coffee beans if that allows a roaster to predict how hard a bean might crash, especially if it’s an expensive microlot !
Furthermore, it’s nice to see that the washed Kenyan lived up to the common folklore which says that Kenyans are particularly hard coffees ! However, it did not show any noticeable increase in mass density. This may be further evidence that mass density, or at least the Green Farm Coffee method of measuring it, are not that useful to characterize how green coffees behave during roasting !
If any of you roasters out there try measuring your green coffee hardness and notice a correlation with roast behavior, I’d love to hear about it; otherwise, Andy and I will keep you posted about what we find out.
For those interested, here’s the detailed information about each of the green coffees:
Washed Colombian: Laderas Del Tapias
Location: Neira, Caldas, Colombia
Altitude: 1650 to 1950 m.a.s.l.
Varietals: Caturra, Castillo, Bourbon, Catiopes
Owner: Rodrigo Alberto Pelaez
Natural Colombian: Villa Clabelina Natural
Cropster link
Location: Ciudad Bolivar, Antioquia, Colombia
Altitude: 1510 to 1800 m.a.s.l.
Varietals: Colombia, Caturra
Owner: Finca Villa Clabelina
Washed Ethiopian: Suke Quto
Trabocca link
Location: Guji, Ethiopia
Altitude: 1800 to 2200 m.a.s.l.
Varietals: Kurume, Welicho
Owner: Suke Quto farm
Natural Ethiopian: Chelelektu Natural
Ally Coffee link
Location: Yirgacheffe, Ethiopia
Altitude: 1800 m.a.s.l.
Varietals: Kurume, Dega, Wolisho
Owner: Chelelektu washing station (several small farms)
Natural Brazilian: Pedro Humberto Veloso
Location: Carmo do Paranaiba, Santa Cecília, Santa Catarina, Brazil
Altitude: 980 to 1120 m.a.s.l.
Varietals: Catucaí 785-15
Owner: Pedro Humberto Veloso
Washed Kenyan: Kii AA
Cropster Link
Location: Kirinyaga, Kenya
Altitude: 1600 to 1800 m.a.s.l.
Varietals: SL28, SL34
Owner: Smallholders at Kii wet mill factory
Decaffeinated Washed Colombian: Cauca Inzá
Location: Cauca Inzá, Colombia
Altitude: 1750 to 1900 m.a.s.l.
Varietals: Caturra, Colombia, Castillo
Decaffeination: Ethyl Acetate
Owner: Asorcafe
I’d like to thank Andy Kires from Canadian Roasting Society for allowing me to run this cool experiment by providing the green coffee !

Hello, my name is James from Bean Brothers Korea.
Many rosters make a correlation between density and development, and I thought it would be more important. In fact, there was no significant number difference when measuring density. The proportional correlation between density and roasting results was also difficult to find.
Rather, I think the size and hardness of the beans are important variables to measure actual development. The size determined the spatial size of the heat transfer, and I thought that rigidity is like a barrier through which heat penetrates inside. (We need to check if this is a barrier or a better bridge.)
It is also thought that hardness will also affect the development of cracks. Beans that are expected to be hard beans are exceptionally louder cracks.
If we have a criterion for the firmness and size of the beans, it is expected that we will be able to determine the minimum level of development for each bean. Each bean can have a standard of light roasting!(not by tasting!)
LikeLike
Thanks for your comment ! That seems to make sense yes
LikeLike