Over the past year, I have logged the details of just over a thousand pour over brews that I prepared and drank. I had started doing this with several goals in mind, and one of those was to understand whether different coffee varieties behave differently when brewing pour overs. Over this period of time, I have learned how to improve my brew method to obtain more repeatable results and better quality extractions, and I also changed coffee brewing gear a couple times. I also realized several months back that the coffee concentrations (TDS) I was measuring with my reflectometer were initially not as precise as I thought, and I wrote a blog post about how to measure them better when I figured this out.
I decided to have a look at the brews where I used exactly the same coffee to water ratio (1:17), the same dripper (plastic V60), grind size, burr and grinder (the Weber Workshops EG-1 with SSP ultra low fines burrs), brew water (the Rao/Perger composition as described here) as well as method (which I describe here), with doses between 20 and 22 grams. I allowed for a small range in doses because in a conical dripper, this range of doses corresponds to a very small range of bed depth (4.65 cm to 4.80 cm, or a change of only 3%). The detailed list of all coffee gear I use can also be found here. These criteria narrowed the list down to 416 brews prepared in an identical way, but with a range of 192 distinct coffee bags.
One thing that jumps immediately when looking at the data is the wide range of average extraction yields that result from brewing different coffee beans. Even at the stages where my brews got consistent to within 0.2% in extraction yield between brews of the same beans, changing beans caused my extraction yields to vary widely across ~20% to ~23% average extraction yields. This figure shows the average and range in average extraction yields that I obtained when I was brewing coffee from a bag that mentioned each coffee variety:
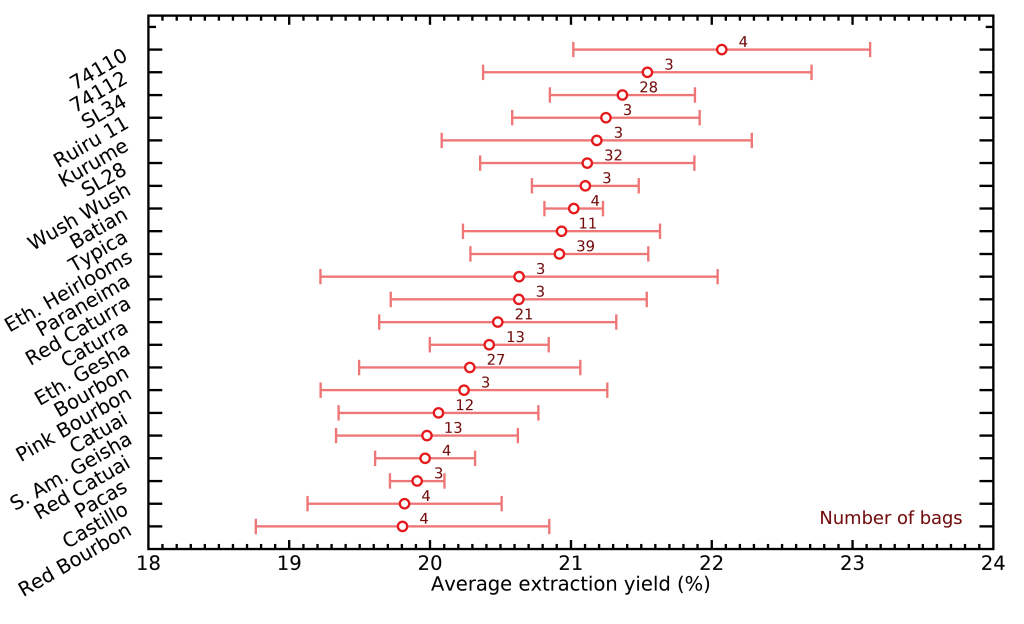
I found it really interesting that the Kenyan variety SL34 comes much higher than SL28 in the figure above. We only rarely get to taste SL34 alone as it is almost always mixed with SL28, but that trend tells me that SL34 may contribute a lot more solubles because bags with both SL28 and SL34 seem to extract a lot more stuff than those with only SL28 !
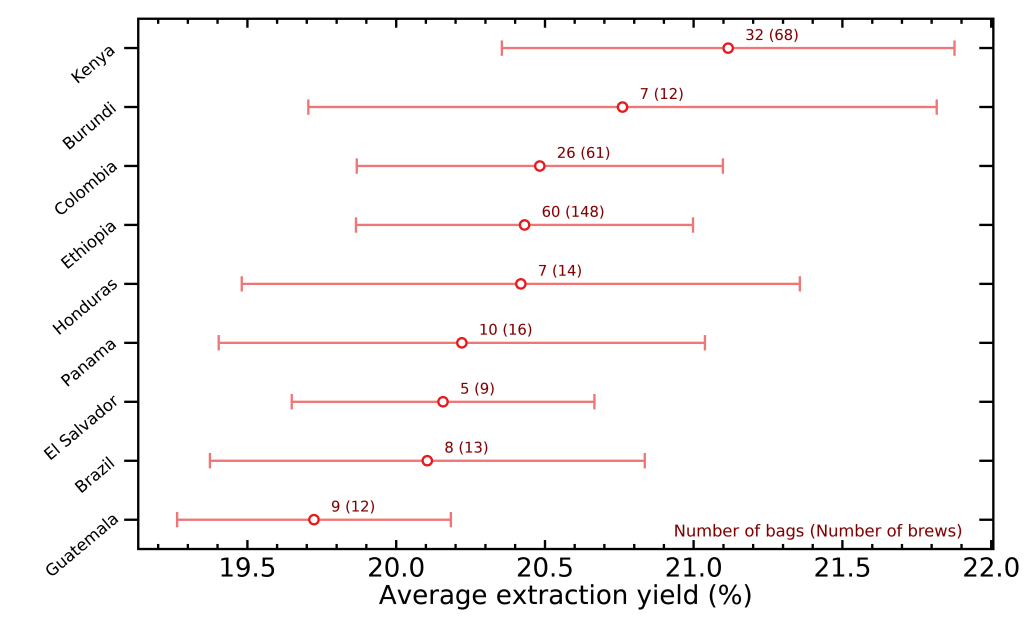
As you can also see, varieties typically grown in Kenya (SL34, SL28, Ruiru 11) and Ethiopia (74110, 74112, Kurume and Wush Wush) produced the highest extraction yields, whereas those often grown in South America (Bourbon, Catuai, Pacas, Castillo) tended to yield lower ones. A particularly interesting case is that of Gesha, a variety originating from Ethiopia (as they all do in reality) that is now also grown in South America, often with a different spelling “Geisha”, and likely with a slightly different genetic makeup (Please see Getu Bekele’s excellent book “A Reference Guide to Ethiopian Coffee Varieties” for more on this). Again, the general trend where African coffees generate more solubles is still observed: Ethiopian Gesha extracts about 0.4% higher than South American Geisha on average.
These differences across origin countries can be viewed with the following graph:
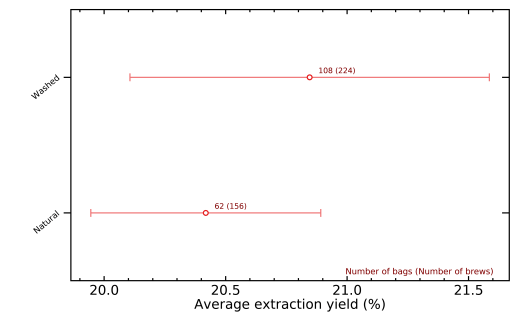
Now, the explanation for these trends is unclear: it could be explained by differences in the genetics of the coffee, in how these genes get expressed across different environments, or it could also be caused by different agricultural or processing practices. I doubt that processing alone could explain the differences, as grouping the values along natural or washed coffees shows a weaker trend where washed coffees seem to extraction about 0.5% higher on average:
The possibilities that I just mentioned all assume that the different extraction yields are actually real, in the sense that African coffees bean tend to contain more soluble materials. However, there could be a different explanation; the different chemical profiles that correspond to different varietals might also be throwing off the calibrations of the VST refractometer, which uses the refraction index of the coffee and translates this into a concentration with their proprietary calibrations. I don’t know how sensitive these calibrations are on the exact chemical profile of the coffee, but I suspect there may be some variations in the sense that obtaining extremely accurate extraction yields would require using a different calibration for Ethiopian, Kenyan or Colombian coffees for example.
Probably the most interesting trend that appeared in the data is this one:
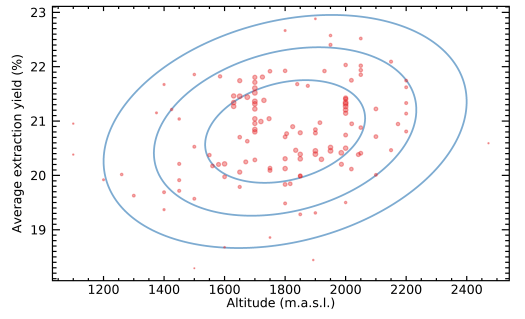
Each red circle in the figure above is a distinct bag of coffee. The symbol size is larger for points in denser regions, to give more focus on the general trend and away from lone outliers. The blue ellipses are contours of a 2D normal distribution that fits the data (at 1, 2, and 3 times the characteristic width), and the orientation of these ellipses are caused by the correlation between altitude and average extraction yield – the Pearson correlation coefficient is 25.6%, which means that the angle of the ellipses is significantly off from horizontal, as you can see.
It looks like coffees grown at higher altitudes produce higher average extraction yields ! This would favor the hypothesis that the differences are real and due at least in part to growing conditions, because there would not be any reason for this correlation between extraction yield and altitude to appear if it was purely caused by the VST refractometer calibration getting slightly thrown off by different chemical compositions. Specifically, some research by Vaast et al. (2006) and Worku et al. (2018) showed that higher-grown coffees tend to concentrate more nutrients into their seeds in harsher growing environments such as high-altitude farms. This may be an evolutionary strategy for the coffee tree to maximize the survival rate of its seeds that will face more difficulty in growing into new coffee trees.
Another effect that I find interesting is how varieties and origin countries might affect the total brew time. The reason to expect variations in brew time has to do with how brittle coffee beans are, because their brittleness will affect how much coffee fines are produced during grinding. Basically, more brittle coffees will generate more fines, and will result in longer brew times. This will likely be strongly affected by roasting style too, but the initial moisture, density and hardness of the green coffee or the bean size may all have an effect, which would introduce variations across varieties and origins.
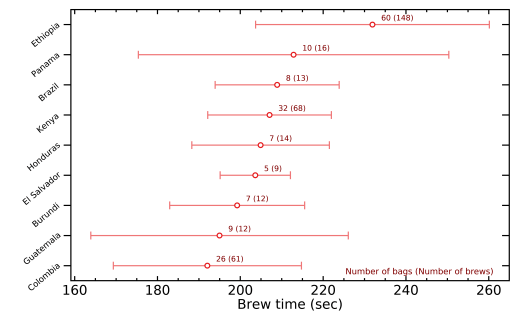
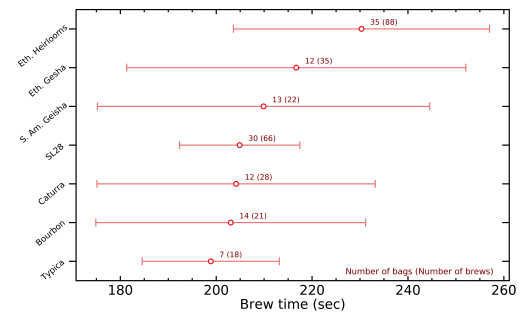
One interesting thing about the figures above is that they confirm some well known facts about Ethiopian coffees: they seem to generate a lot more fines, and clog a lot more easily as a consequence. I often heard that Kenyans also behave this way, but my data does not seem to suggest they do, or at least much less than Ethiopians !
Differences in processing did not seem to affect brew time significantly:

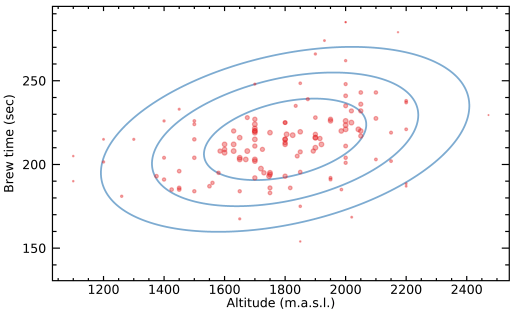
But differences in growing altitude also show a strong correlation (a Pearson correlation coefficient of 36.3%), perhaps indicating that harsher environments may also affect the physical structure of the beans, potentially making the beans harder, drier and/or smaller, which will lead to more fines once they are ground:
Another possible explanation of these trends in brew time could be that it only has to do with roasting, but that these correlations were introduced because we tend to like different coffee beans roasted at different development levels on average. While this almost certainly happens to some extent (e.g., more expensive Ethiopians and Kenyans getting roasted more lightly to preserve more origin characteristics), I doubt it is the only explanation, and I suspect that either genes or growing environment also have something to do with it.
Note that I do not share my complete brew log publicly, but it is available through my Patreon page, specifically here. Keep in mind I do not share a live version even on Patreon, because it requires some data management before I share it. The current version has 636 brews and covers all of 2019, and I plan to update it with the next 400 brews in the coming month or so.

Great post, good to see some big & meaningful data. FWIW my findings are not dissimilar WRT Kenya & Guatemala/Brazil in trend re. origin vs EY.
Kenya 58 brews 20.7%EY (all avgs)
Rwanda 48 brew 20.3%EY
Colombia 67 brews 20.3%EY
Peru 19 brews 20.2%EY
Ethiopia 97 brews 20.2%EY
El Salvador 23 brews 20.1%EY
Burundi 30 brews 19.8%EY
Costa Rica 33 brews 19.5%EY
Guatamala 56 brews 19.5%EY
Nicaragua 18 brews 19.5%EY
Brazil 10 brews 18.9%EY
Do you have any subjective scores on these brews too? I generally preferred Rwanda, Kenya, Colombia & El Sal.
LikeLike
Thank you. Interesting post, and lots of good info. But as someone who likes Robusta and also lived in Italy where a lot of the espresso has some Robusta in the mix, I prefer a stronger blend.
High altitude growing usually means Arabica, and generally excludes beans grown at lower altitudes such as Vietnam. Having visited Vietnam, which is supposed to be the 2nd largest grower of beans in the world, after Brazil, many believe that Asian beans are grown for cheap instant coffees, and thus 100% Arabica is plastered proudly on everything else. Your thoughts please.
LikeLike
Great read. Wine growers also discuss harsher environments leading to more complex grape characteristics.
LikeLike
Hello.
it is very interesting post !
other than, the most thing i like is that i can be got insight a trend of relationships between data.
can i share your post on my blog ?
my blog is dealing with science of coffee plants and coffee extraction
Thanks !
LikeLike
Sure, as long as you cite your source with a link
LikeLike
Very interesting and I look forward to digging into the info more. Quick question: what did you define as “high altitude” and did you correspond latitude to that variable?
LikeLike
Great read, thank you so much for sharing this!
If I am reading this correctly, Ethiopian coffees tend to have higher extraction yields and produce more fines when ground, resulting in longer brew times. Do you think the higher extraction yields for these coffees is due to the combination of there being more fines (which extract faster) and a longer brew time (the more time that water is in contact with the grounds, the more will be extracted)?
This does not seem to apply to Kenyas, though, since your data shows that Kenyan varieties tend to have higher extraction yields, but do not produce as much fines as Ethiopian coffees, since they have a shorter brew time than Ethiopian coffees.
Would love to know your thoughts!
LikeLike
I think that, in the case of Ethiopians, the TDS readings are higher even if you would adjust for brew time. Whether this is caused by truly more solubles in the beans, or by a different chemical composition that throws off the refractometer, I don’t know yet.
LikeLiked by 1 person
Fascinating read, thanks for taking the time to write it!
LikeLike