Header photo by Juan Silveira.
A while ago, I read an interesting idea from Robert Mckeon Aloe on Matt Perger’s Telegram channel about measuring the total dissolved solids of a live espresso shot with the Decent DE1 machine, by comparing the output gravimetric flow measurements with a bluetooth-connected Acaia scale, to the input flow above the puck at the shower screen as predicted by the DE1. I think this is a really good idea in principle, but when I read this I immediately expressed worries that I didn’t think it could be done accurately yet because of the systematic inaccuracies with which the DE1 currently estimates flow rate.
The idea is simple; the flow rate at the shower screen tells you what volume of water is incoming per unit time, and the Acaia scale measures how much total mass is falling into the cup per unit time. The key here is that this total mass is not only made up of water, but it also includes dissolved chemicals (what we usually refer to as total dissolved solids, or TDS), oils, dissolved CO2 and undissolved solids in suspension. Using the well-known mass density of water, one can calculate how much of that total weight is made up of water, subtract that and obtain the weight per unit time of everything else. This is not exactly a live measurement of TDS, because of all the other stuff in there, but it might very well be a good tracker of TDS if the dissolved solids make up most of the non-water mass.
Basically, Ray Heasman at Decent uses a purely empirical and very complicated model that takes the voltage of the DE1’s vibratory pumps as an input, and predicts how this relates to the flow of water at the shower screen. This is quite crazy, because the answer depends on so many factors, and changing a single tube in the machine can throw off these predictions. Even worse, the answer is different when the pressure changes, and the properties of the user’s electrical grid can also affect this. Somehow, Ray managed to pull this off by gathering enough data and building a predictive model that works reasonably well within typical espresso settings. I think that this is quite a feat, and it shows how much real geekery is going on under the hood of this fantastic machine.
Because the flow model depends on so many parameters, it is not rare to see the flow rate being off by 10-20% on the DE1. Therefore, I thought we could not reconstruct something useful and repeatable in terms of a live TDS curve during a shot that is based on the difference in output weight minus input flow of water. Worse, the measurements provided by the Acaia scale are very noisy, especially when estimating the change of weight per unit time. After a shot is done, it is possible to smooth the gravimetric data to make a useful comparison, but doing so live in an accurate way would be extremely hard (although probably not impossible). Readers could be tempted to also worry about the Acaia readings lagging behind (as I was), but because water is incompressible at 9 bar, the should be no lag in terms of the flow measured at the bottom of the espresso basket and that at the top of it, and the only sources of lag that remain are (1) the freefall of the fluid (about 0.136 seconds for a 91 mm fall in my case) and (2) any lag in the Bluetooth data transfer to the DE1, which I suspect is also not too significant.
Things would get much worse if one would attempt predicting the average extraction yield by summing up the TDS curve at every moment in time, because the inaccuracies would pile up, resulting in a very large measurement error. After having this discussion with Robert, I kind of forgot about the idea, maybe a bit too fast.
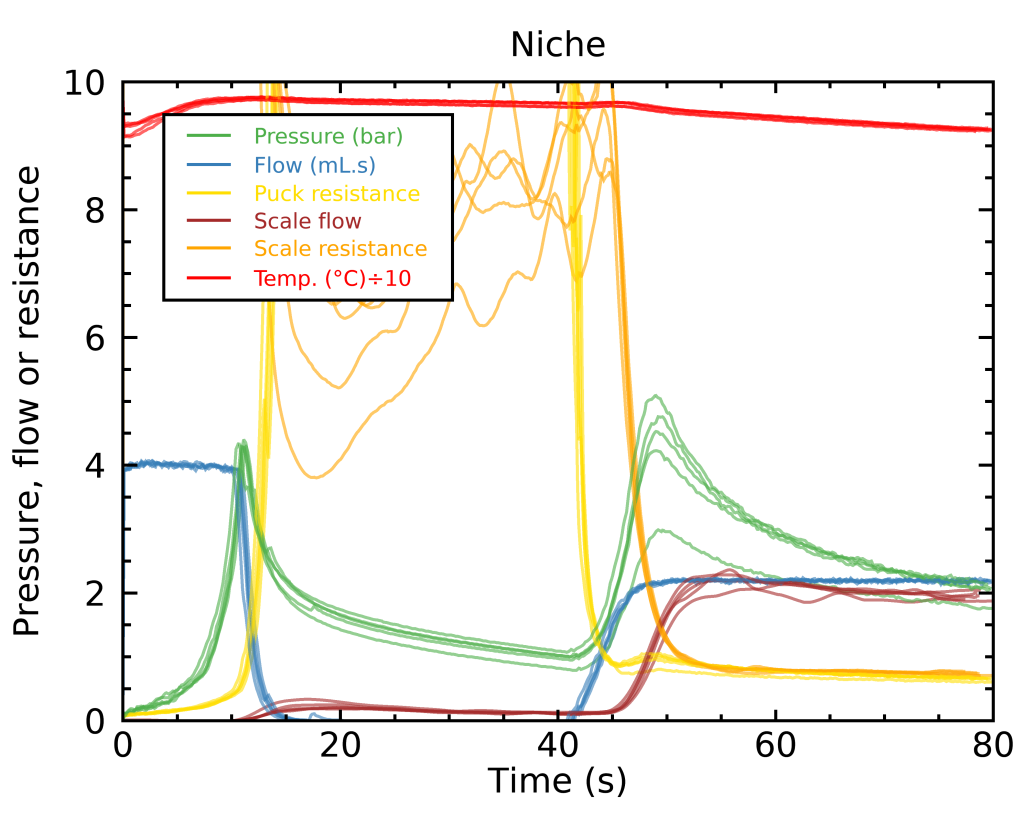
More recently, when I published my experiment on comparing blooming shots pulled with the Niche or the EG-1, I noted that the gravimetric flow was tapering down near the end of the shots when the DE1 was trying to keep the flow constant (blooming shots are flow-controlled and aim at a 2.2 mL/s flow rate at the shower screen). Somehow having already forgotten about the TDS discussion, I immediately blamed the big change in pressure that probably threw off Ray’s model, and I didn’t think of testing whether the TDS curves I built from the viscosity calculations could explain the difference.


Yesterday, I was reading about a feature on the DE1 users forum where a new firmware upgrade allows you to correct for any constant offset between the predicted and measured flow. Decent user Ed Hyun built a small Python program to help calculate this offset by using all of your past shots, instead of running a calibration profile and waste some coffee (I am still constantly amazed by the Decent users community), and on that thread, a user named Joe Duncan resurfaced that idea of the declining gravimetric flow measurements being due to the change in TDS rather than errors in the DE1’s model. When reading this, my mind clicked that this might actually also explain the tapering gravimetric flow in my previous experiment !

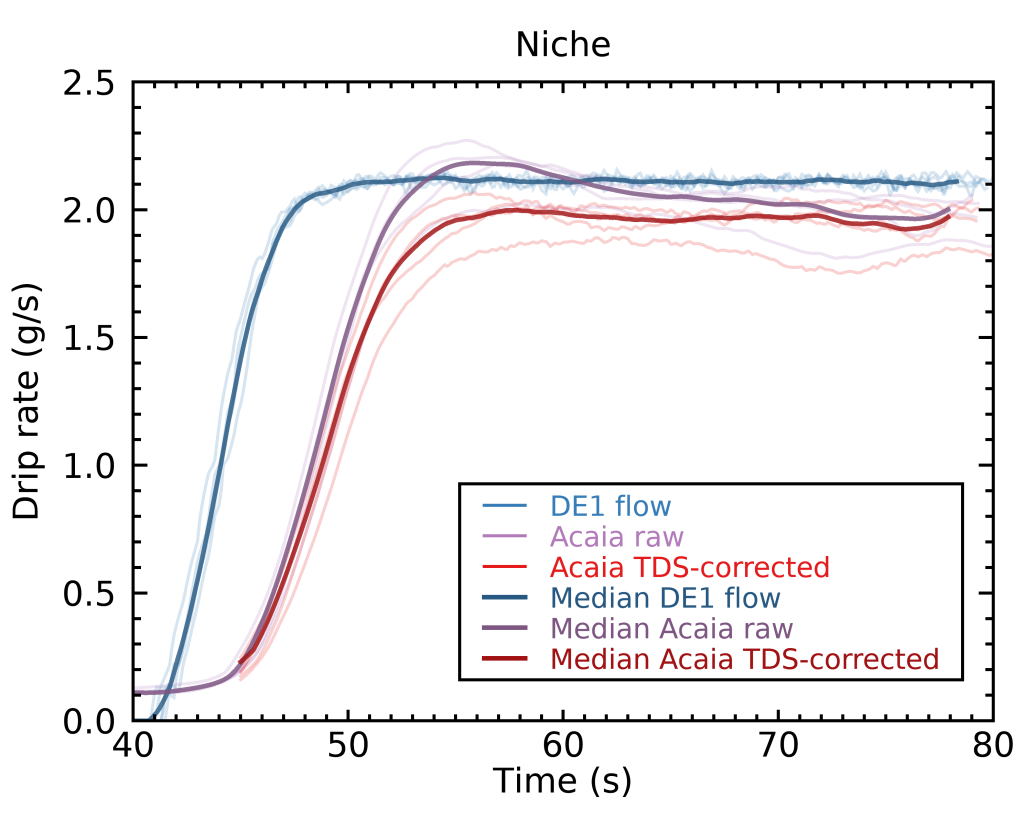
So I decided to go ahead and pull the data from this last experiment, and try correcting the Acaia gravimetric flow rate by multiplying it with a factor (1-TDS/100), where TDS are the live TDS graphs as a function of shot time that I derived from my calculations of the fluid viscosity. This allows to estimate the gravimetric flow of water only, without the dissolved chemicals in it. I also used tabulated values for water density versus temperature to apply the appropriate correction to the DE1 volumetric flow rates.


Indeed, this correction seems to account for most of the slope in gravimetric flow rate ! This is consistent with my hypothesis that changes in puck resistance are driven by changes in TDS and viscosity, and it also lends credence to the possibility of estimating live TDS with Robert’s idea, although we would always need to take such curves with a grain of salt because of the other solids in the beverage (oils, undissolved solids) and the current limitations of the DE1’s flow estimates.
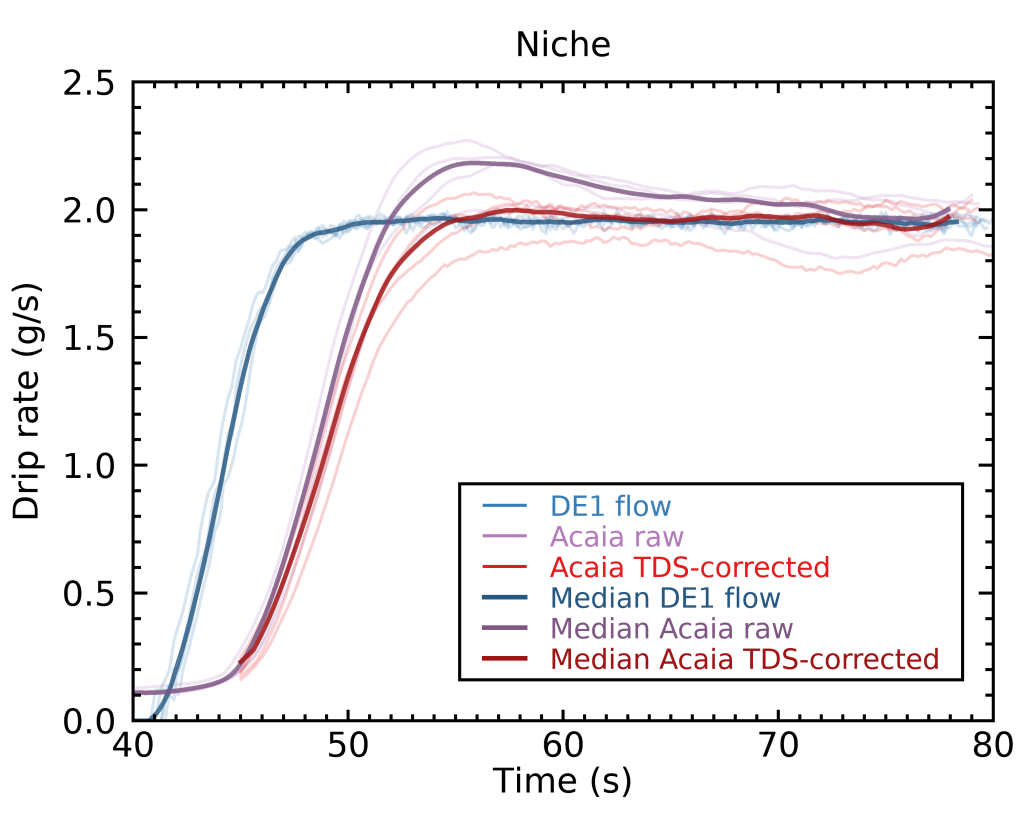
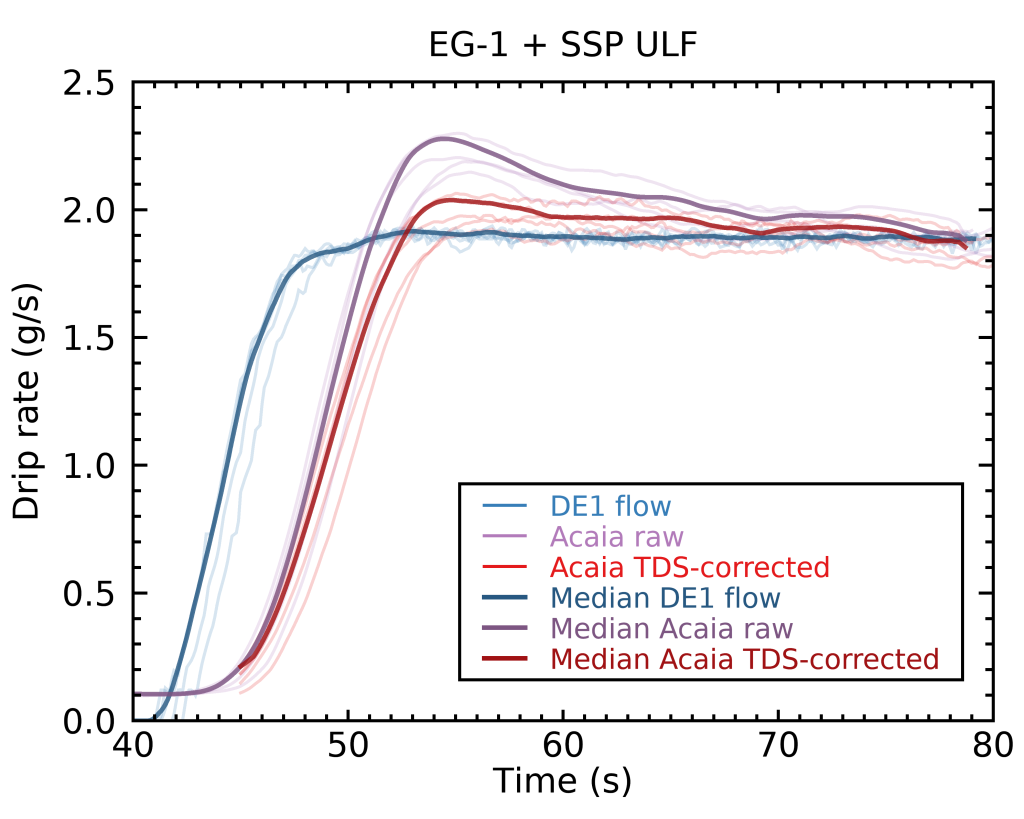
Now, there is still a non-negligible constant shift between the gravimetric and volumetric flow rates, and that could be due to specificities of my own DE1’s tubings or my local electrical grid. Thankfully, I can easily calculate this shift and correct for it, by looking at the median ratio of flow in the last 10 seconds of each shot. Quite interestingly, this factor was slightly different for the Niche and the EG-1; The DE-1 over-predicted the Niche flow rates by 8 ± 2%, and the EG-1 flow rates by 12 ± 1%. This difference between the two grinders is on the edge of being statistically significant, and could be explained either by a systematic error in the exact TDS values I predicted from my puck resistance – EG-1 flow rates would be affected more by an error because of its higher TDS on average – or to a different amount of oils and undissolved solids between the EG-1 and the Niche.
Applying these constant shifts to the flow rate curves shown above yields the following:


This last set of figures also shows something interesting; the correction seemed to have removed all of the Niche’s slope, but not exactly all of the EG-1’s slope. This makes me favorable to the hypothesis that my viscosity-based TDS curves might be a bit systematically off in the case of EG-1, and the true TDS might actually be slightly higher a bit early in the shots, whereas this may not happen with the Niche.
All of this means that the Decent might actually be able to keep a constant flow rate even when the pressure changes significantly. The decrease in gravimetric drip rate can likely be attributed to changes in TDS and other beverage content, meaning that I was probably worrying way too much about tweaking my profile’s flow rates to achieve a constant gravimetric drip rate.
TL;DR
The fact that the Acaia scale-based flow rates in my previous experiment tapered off near the end of the shots was likely related to the TDS of the shots decreasing, in a way consistent with the TDS curves I had predicted.


Yes
Vào 08:37, T.3, 13 Th7, 2021 Coffee ad Astra đã viết:
> jgagneastro posted: ” Header photo by Juan Silveira. A while ago, I read > an interesting idea from Robert Mckeon Aloe on Matt Perger’s Telegram > channel about measuring the total dissolved solids of a live espresso shot > with the Decent DE1 machine, by comparing the output gr” >
LikeLike
Thanks for your post. You explanation about tsd and washout probably explain why I see drop of head pressure after around 15 seconds of extraction with my Lelit Bianca. I compensate with the flow control paddle (a marvellous feature).
LikeLike