Reminder: as an Amazon Associate I earn small commissions from qualifying purchases made through the Amazon links identified below.
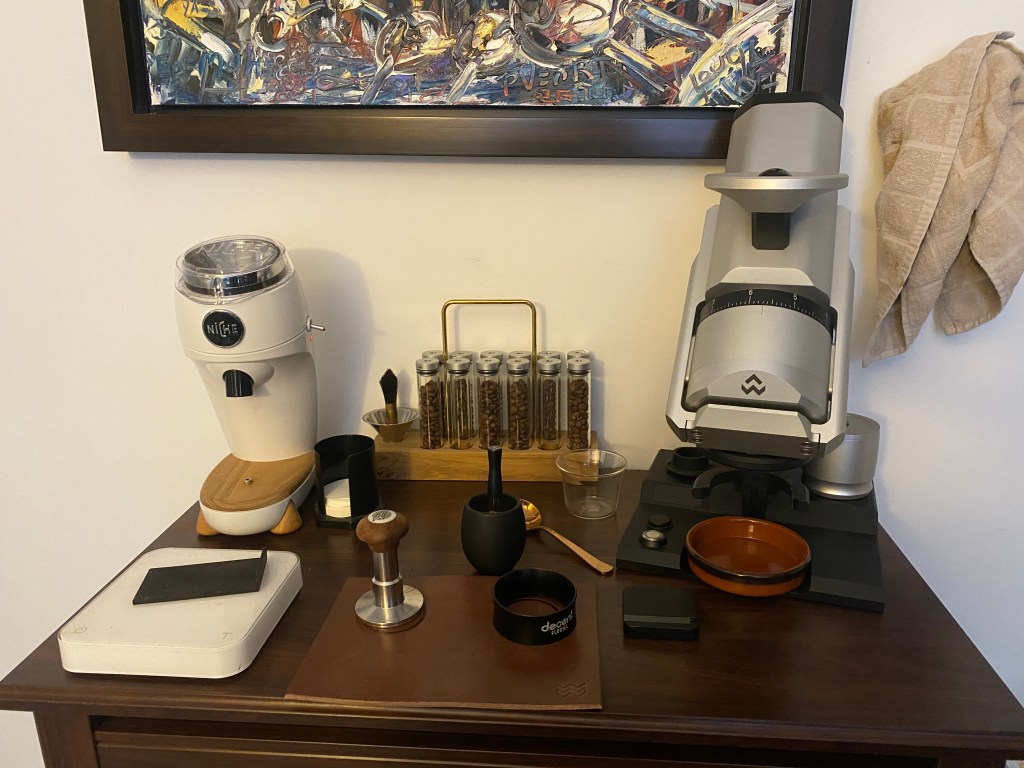
Before I begin to characterize how different grinders or espresso preparation methods affect extraction and taste, I decided to test how repeatable my shots of espresso are. The DE1 Decent Espresso machine is pretty nice for this purpose because it shows you graphs of your live pressure, the flow of water coming out of the shower head, and how the weight of your espresso beverage changes over time if you connect a Bluetooth scale to it.
To carry this experiment, I bought a large bag of washed Mas Morenos Honduras coffee roasted by my friend Andy Kyres who owns Color/Full Coffee Corp, dialled it in on the Niche Zero grinder, and followed Scott Rao’s puck preparation technique that he posted on his Instagram TV channel. I started on the Niche first because I can compare it to other Decent users more easily, and I plan to do a similar experiment on my EG-1 grinder very soon.
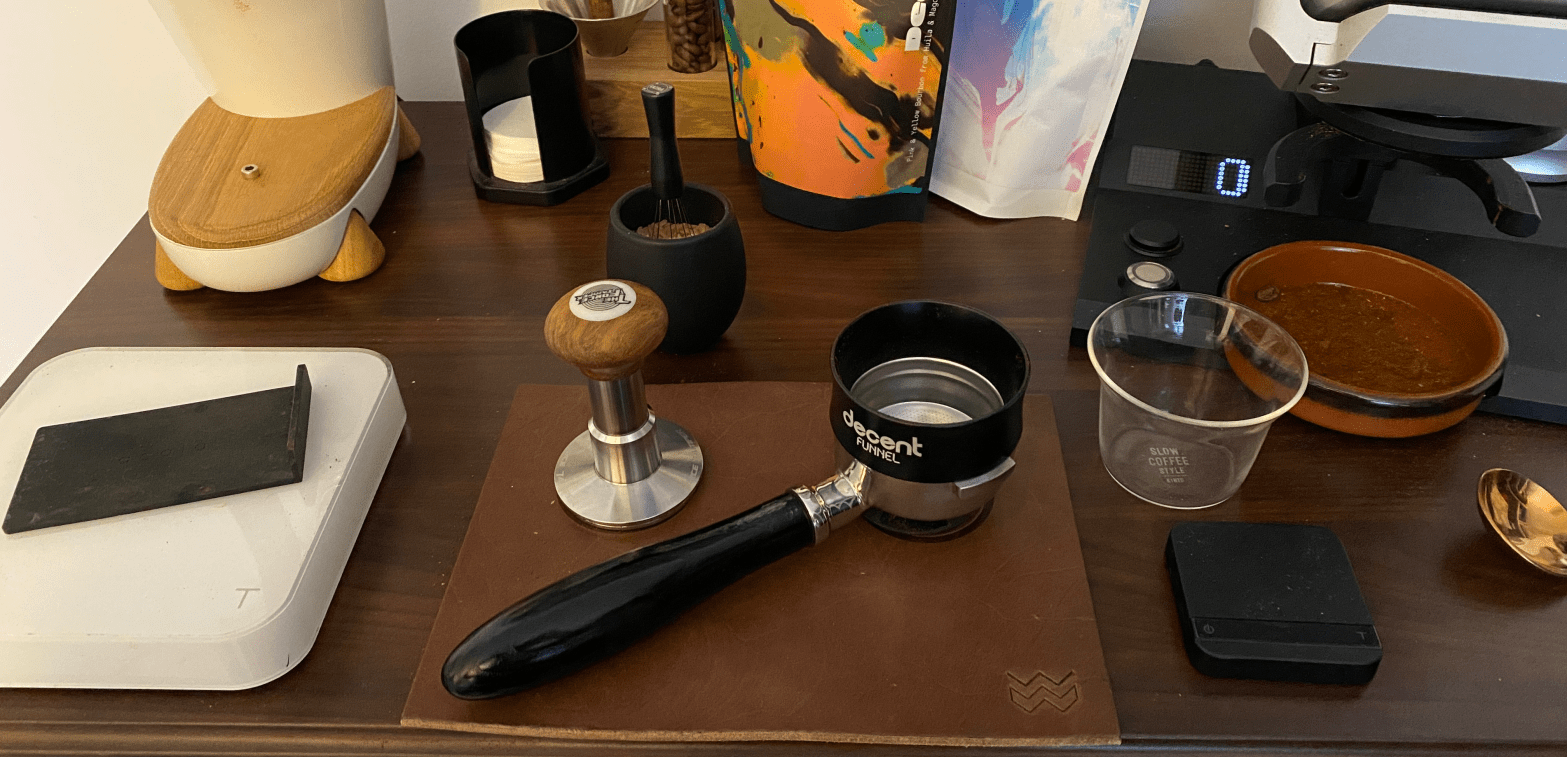
For this experiment, I dosed 18.0 grams of coffee in the Niche and ground directly in the portafilter, like Scott shows in his Instagram video. I used grind size 14.0 on the Niche for the whole experiment. I made sure to send grounds as much as possible at the edges of the portafilter at first, and then filled up the rest in a circular motion. To do this, I moved the portafilter around in a “nutation motion” with my left hand while the Niche was grinding. Here’s a video of my attempt at this:
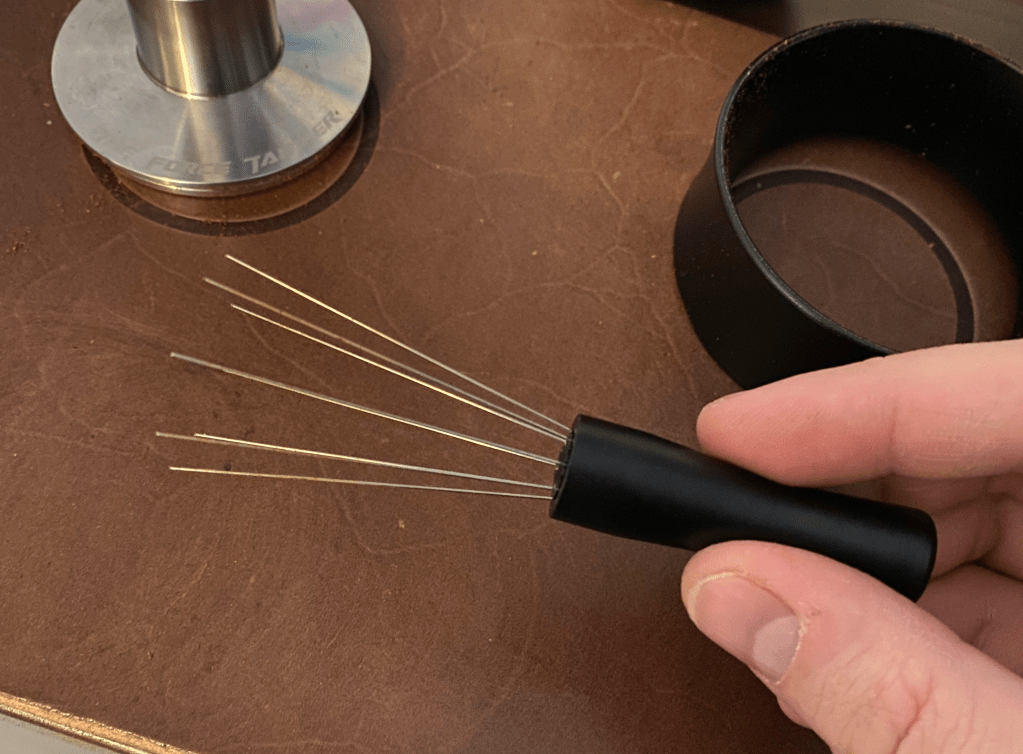
I used the tall Decent portafilter funnel to help get all of the grounds in my portafilter, and Levercraft’s WDT tool in its default configuration. Levercraft’s is my favorite WDT tool so far; I find that the large number of needles (8) and their wide angle makes it much easier to distribute the grounds evenly and obtain a level puck.
I decided to test a few different puck preparation techniques while I was at it. First, I tried using exactly the Weiss Distribution Technique (WDT) method that Scott showed on his IGTV channel, where you only de-clump and stir the top third of the depth of the coffee puck before tamping. You then tap gently and tamp once, trying to get a coffee puck that is as level as possible. I’ll call this method “surface WDT” here. You can see a demonstration in this video:
I also tried another method, “deep WDT”, that is more popular among DE1 users on the Decent Diaspora forum, where the WDT tool is inserted at full depth and used to stir the coffee grounds more vigorously in circular patterns, slowly going up and then finishing on the surface, like I do in this video:
This is followed again by a small tap of the portafilter on the tamping mat, and by tamping. I used The Force Tamper (Amazon Affiliate link) to reduce variations due to non-level tamping. I found that holding the base of the tamper with my left hand and then tamping with the right hand allows me to obtain a more level coffee puck, like I show in this video:
I left the tamper at its default level of pressure. Scott Rao recently popularized the use of paper filters at the top of the puck to help distributing flow evenly across the top of the puck, and I decided to also include that method in today’s experiment. With the first two methods that I described above, I did not use any paper filter. So I added two more kinds of methods where I did either surface WDT or deep WDT, and also added a dry Cafelat Robot 58mm paper filter on the top of the coffee dose. I always added the filter such that the creped side was facing the coffee puck, because this is where I want to maximize the surface of contact. I just placed the dry paper filter on top of the tamped coffee bed like I show in this video:
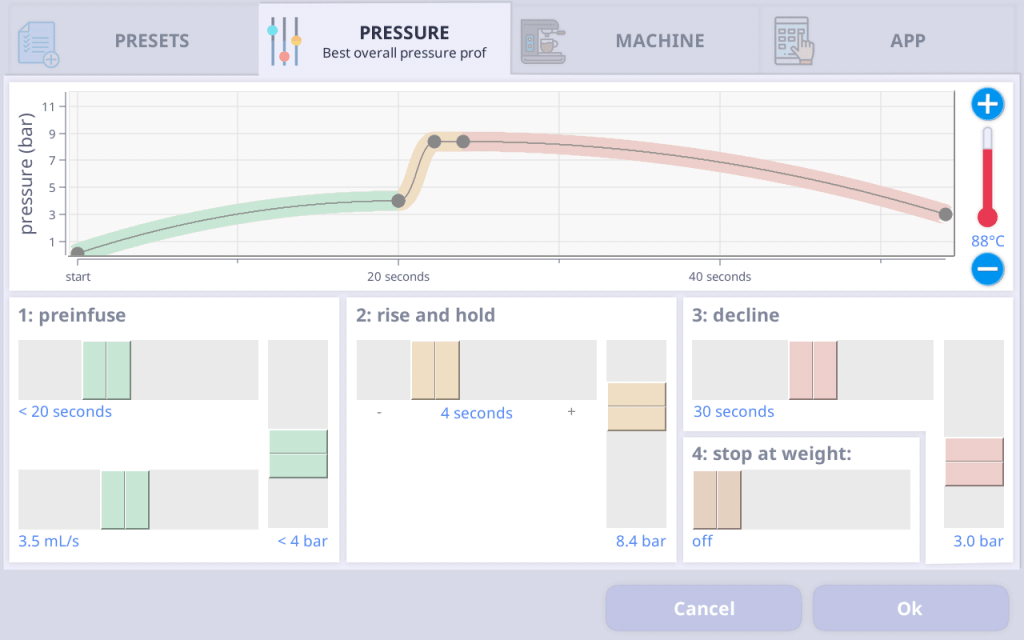
In order to minimize any systematic effects of my getting tired, slowly improving my technique, or the grinder or DE1 getting warmer, I alternated between methods. I started by pulling 6 shots where I alternated between surface and deep WDT without paper filters, and then I started alternating between all four methods. I used the “Best Pressure Profile” that peaks at 8 bar after preinfusion, and then slowly goes down to lower pressures over time. My goal was to assess how repeatable would be the puck resistance and its decline with time, so I like to keep a fixed pressure for this experiment because I know changing the pressure from shot to shot could affect the physics of what size of coffee fines can migrate down the puck, and at what rate they do so. I also pulled three shots before starting the experiment, to dial in the coffee and ensure that the DE1’s temperature was stable enough.
Note that I did not refract any of the shots in this experiment: doing this properly takes time, and I decided to focus this experiment on repeatability of puck resistance only, as this allowed me to pull and log 24 shots in a bit less than two hours, probably twice as much as if I had refracted each of them.
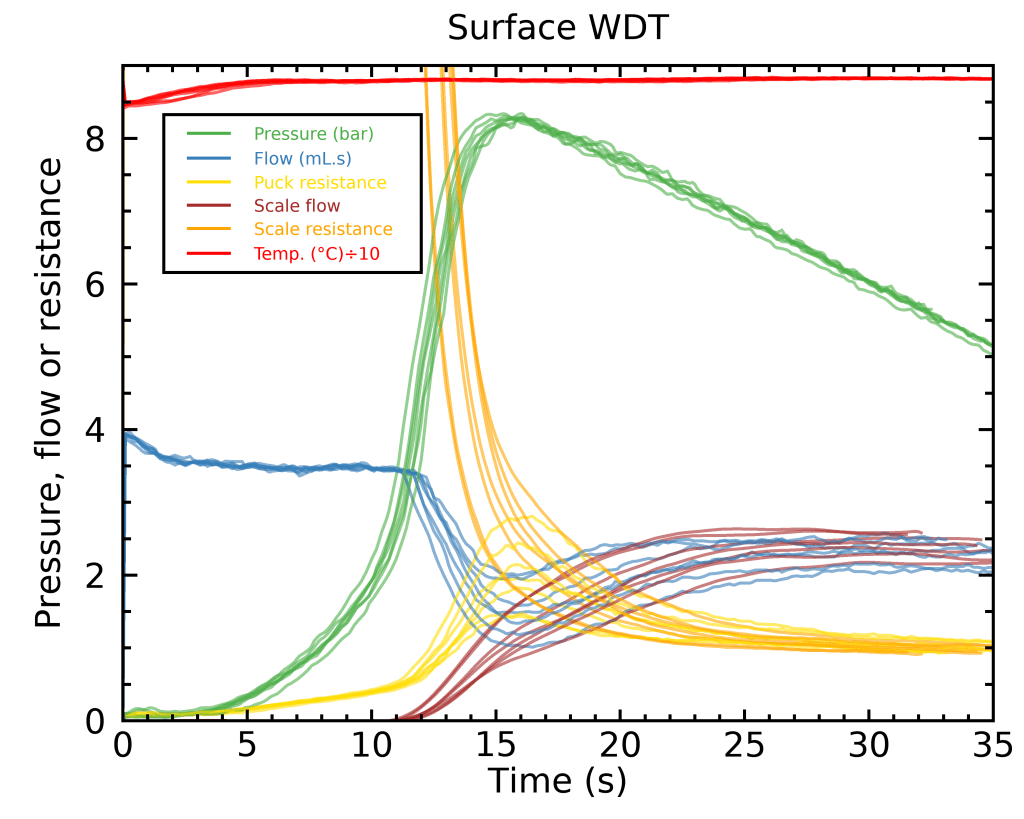
Before we discuss the results of this experiment, it is worth talking a bit about the DE1 graphs for one of the no-paper, “surface WDT” shots described above.

I know the DE1 graphs contain a lot of packed information, especially if you are not familiar with the machine. The green line shows the pressure in units of bar and how it changes over time during the shot; you can see a slow rise of pressure during preinfusion (in the first 10 seconds), which causes the machine to exit the preinfusion phase when a pressure of 4 bar is reached. The blue curve shows the rate at which water flows out of the shower head, as calculated by the DE1, based on measuring the voltage of the pumps and a complicated physical model of the whole machine. As you can see above, I used a 3.5 mL/s preinfusion during the preinfusion. The early 4 mL/s start is related to the firmware set-up of my machine, and I did not bother changing it because I don’t think it matters much for this test.
When the pressure reaches 4 bar, the machine switches from a “flow-controlled” mode to a “pressure-controlled” mode where the pressure is immediately cranked up to 8.4 bar, and then it slowly decreases to about 5 bar at 35 seconds. The red curve shows the temperature near the shower head, in units of degrees Celsius divided by ten. The brown curve shows the gradually increasing weight of espresso as measured by the Acaia Lunar scale that I had connected to the DE1. You can see that the brown curves becomes similar to the blue curve at around 17 seconds: this is when the puck becomes mostly saturated with water, where the flow of water inside the puck becomes the same as the flow of water that exits the puck. Because the DE1 uses a complicated physical model of the machine to estimate the blue curves (the flow from the shower head), it is not atypical to see errors of about 10–20%. It is notoriously difficult to actually measure the flow of water through pumps with a better accuracy in the context of espresso making. This explains why the blue and brown curves are not perfectly on top of each other even late in the shots. The brown curve also includes dissolved solids and should in principle be about 10% higher than the blue curve for a short while, but this effect is dominated by the systematics of the flow calculation at the moment. Even if we had a perfect blue curve, measuring a flow rate very rapidly with a 0.1 gram-precision scale for the brown curve is hard, because the measurement error gets inflated if you try to measure the flow in a very short amount of time. I went around some of this problem by using custom smoothing algorithms I wrote (not those of the DE1), based on running-box local second-order polynomial fitting, a running “median” box followed by a running average-based smoothing box (you can safely ignore all of this sentence if it means nothing to you).
The yellow and orange curves show estimates of the puck’s resistance based on the pressure curve (green) and either of the two flow curves (blue or brown). For reasons that I explained in my last post, the resistance of the coffee puck to the flow of water can be approximated with the flow of liquid through the puck divided by the square root of the pressure drop. In the DE1’s app, these resistance curves actually show the square of the flow (in mL/s) divided by the pressure drop (in bar), and thus estimates of the square of the puck resistance, but through this post I am showing the resistance for simplicity. It makes sense that the yellow and orange curves only meet when the puck is saturated; before that moment, the whole presuppositions of Darcy’s law and the simple characterization of the puck with a hydraulic resistance don’t make much sense because it has not reached the “percolation threshold”, i.e., the point where espresso starts coming out from under the puck.
[Edit Feb. 7, 2021: in the paragraph above I had originally misquoted the puck resistance as flow divided by the square root of pressure, whereas it’s actually the square root of pressure divided by the flow. Thanks to Sam Roesch for pointing this out.]
I believe that the point where the pressure starts to rise during preinfusion corresponds to the moment where the empty headspace above the puck is completely filled with water, and now the machine has to apply pressure to get more water in the system. Water is basically an incompressible fluid in the context of espresso (you need 220 bar to compress water by 1%), but the machine somehow manages to get more water in there before espresso starts dripping out (in all cases, the first drops of espresso appear at 11-12 seconds). This means that something must be compressing, and if it is not water, it has to be the espresso puck. This effect was actually demonstrated quite neatly with transparent portafilters; the coffee puck is compressed by the espresso pump much like a spring, and it decompresses if no more pressure is applied on it. This is why the “puck resistance” as seen from above the puck (the yellow curve) starts to rise at the end of preinfusion. But then, what happens next is interesting: the resistance of the puck gradually decreases, and then stabilizes.
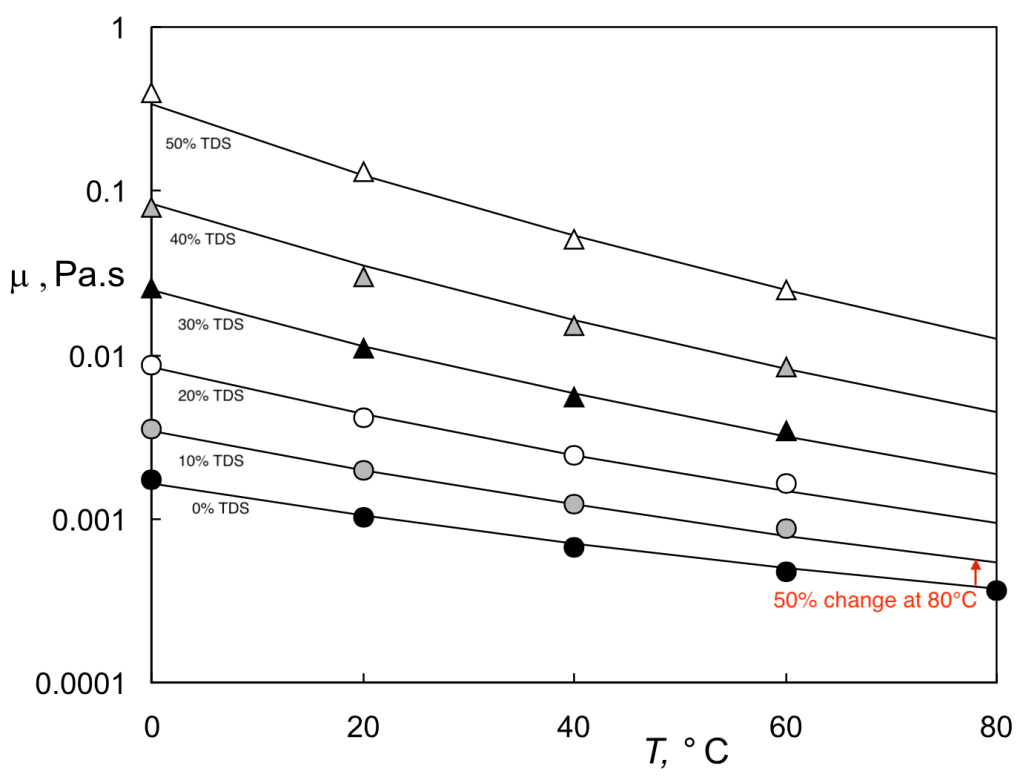
I used to think this was related to the slurry getting less viscous and therefore more easily flowing through the coffee pores as it gets less concentrated. A paper by Sobolik et al. (2002) showed that coffee beverages with concentrations in the range 0—10% show changes of viscosity of about 50% at 80°C (Fig. 3), which would be expected to cause a decrease in puck resistance by 50% as the coffee solubles get depleted. This is not enough to explain the full changes in resistance that we observe (about a factor 2 to 3.5 here), so while it may explain a small fraction of the decrease, it is definitely not the full explanation.
Another potential culprit for this decrease in bed resistance could be related to the migration of fines, a topic I discussed extensively in my upcoming book The Physics of Filter Coffee. However, the change in bed resistance is so strong and abrupt that it made me worry a third cause might be the explanation: the espresso puck might still be partially dry when we are at the end of the preinfusion. I now think that this is the most likely explanation, because adding just a 10 seconds pause after the preinfusion completely removes the peak in bed resistance, and there is no reason for the slurry to have gotten less viscous, or the fines to have moved anywhere, during a 10 seconds pause without flow. This is a topic for a future post, but I believe it will be really important to add a short pause after preinfusion to allow the puck to fully saturate and improve espresso. Scott Rao has done something similar in the past with his “blooming espresso”, but I suspect we may get some of their benefits with a pause as short as 5—10 seconds after preinfusion. Furthermore, I think that the 30 seconds blooming phase of the blooming espresso allows the puck to decompress, and I am not sure that it can be easily compressed again once the puck has been saturated—not that this is necessarily a problem anyway.


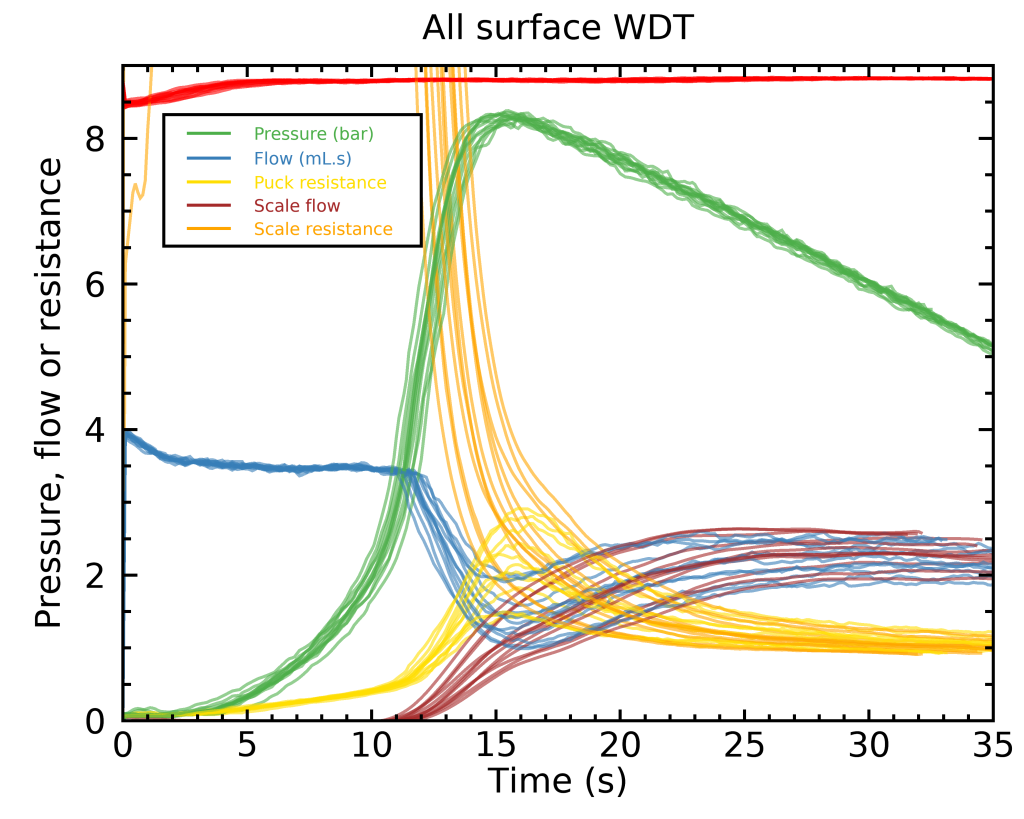
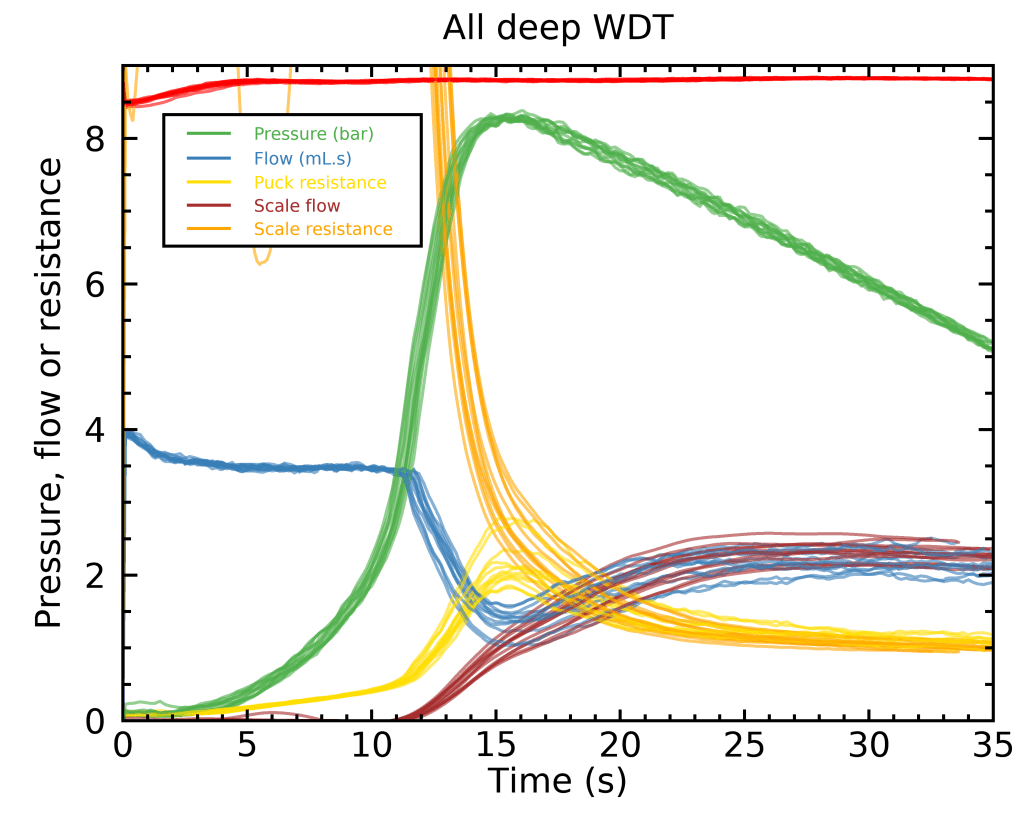
I know this was a wordy explanation of the DE1 graphs, but I think it will really help us better interpret the results of this experiment, as well as future ones. Now, here’s what I obtained when comparing all of the “surface WDT” or “deep WDT” shots without paper filter:
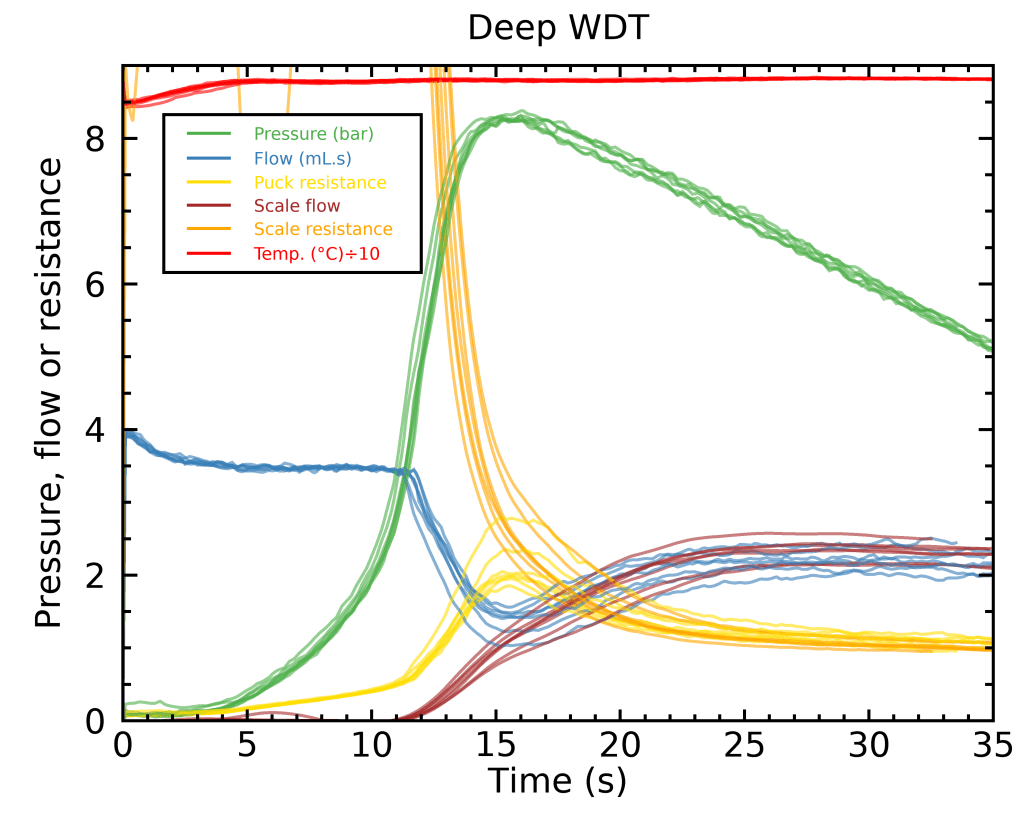
The top panel groups all of the shots where I used the “surface WDT” method on top of each other, and the bottom panel groups all those where I used the “deep WDT” method. You can see that the exact moment where the preinfusion ends varies a bit from shot to shot; this is related to how fast the pressure ramps up to 4 bar during preinfusion, and therefore probably related to slight differences in the puck’s resistance. I adjusted all resistance curves by small deviations in dose to make them most comparable to each other, but this was a small adjustment of less than 1% because all of my doses were between 17.8 and 18.0 grams. One thing is immediately obvious from the graphs above: the peak of the puck resistance (yellow curve) varies quite wildly from one shot to the next, with either method. The “deep WDT” method got me peaks in resistance that are closer together, and therefore a bit less variable, but there are still a few outliers.
I made similar figures for the cases with a dry paper filter on top of the puck:


The graphs above show a very similar picture: the “deep WDT” method still seems to get me slightly more consistent peak resistances from one shot to the next, but the paper filters do not seem to clearly help repeatability.
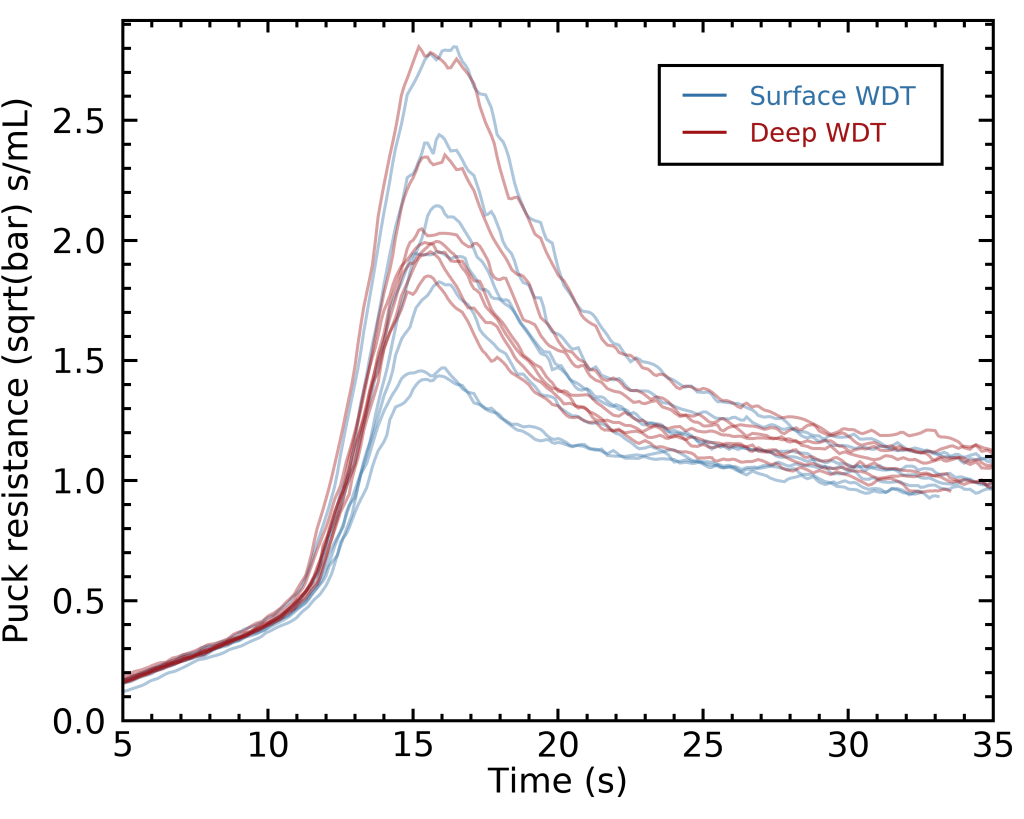
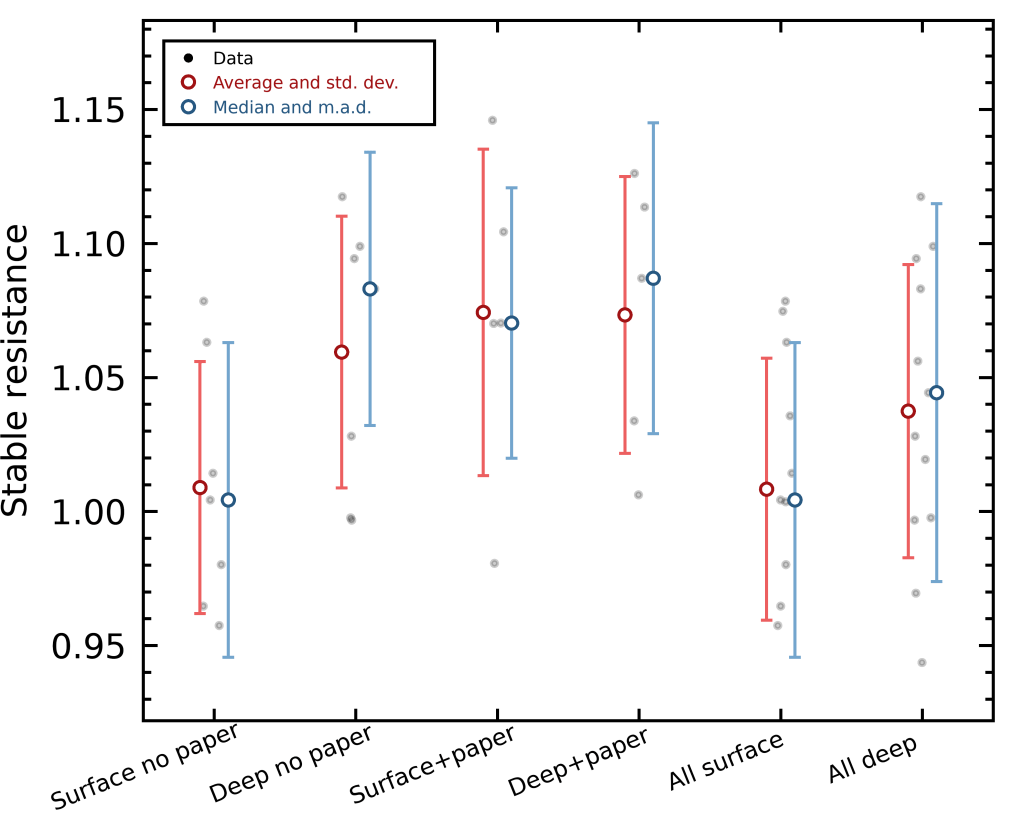
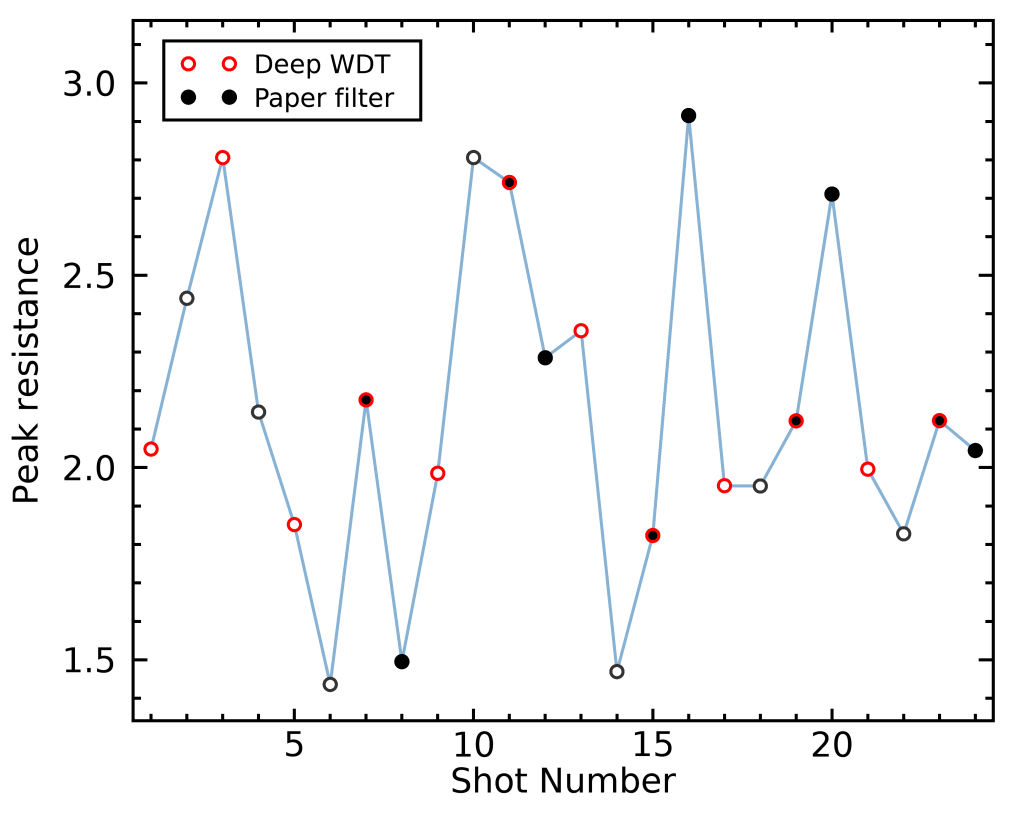
We can compare the exact value of the peak puck resistance as measured from the top of the puck (yellow curve):
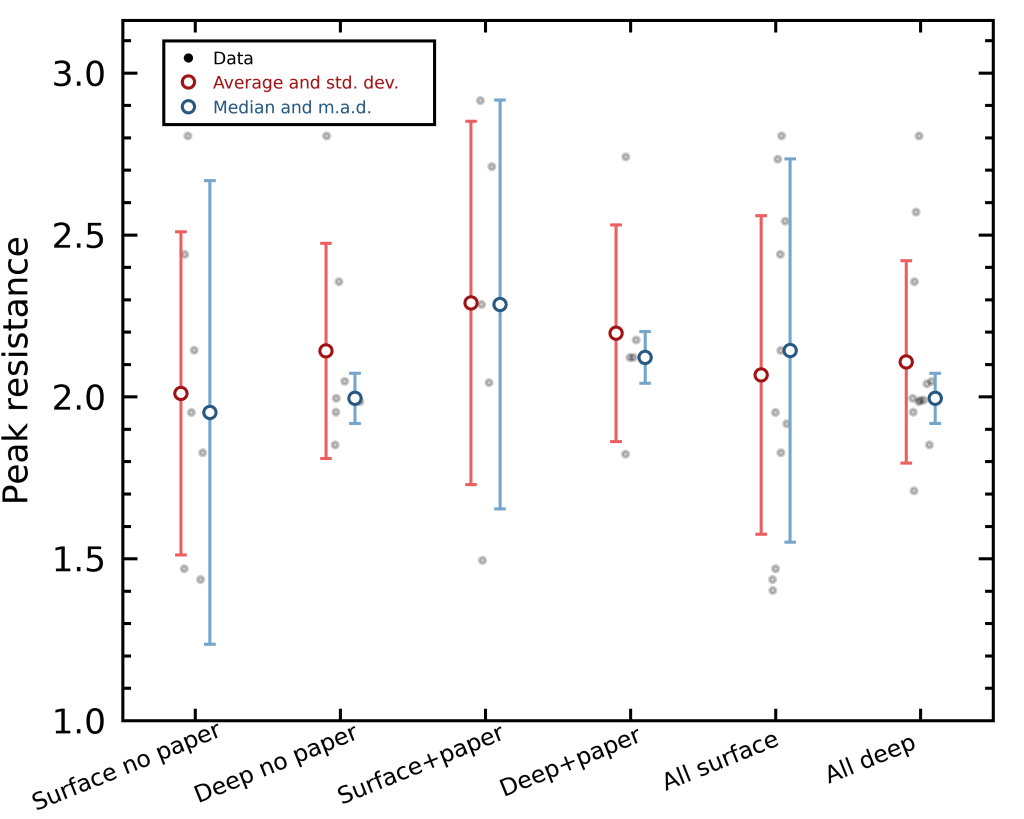
In this graph, I show each shot as a filled grey circle, grouped by puck preparation method. The red circle and vertical bars represent the average and standard deviation for each method, and the blue circle and vertical bars represent the median and median absolute deviations, which are similar concepts to the red circles, except that they are less affected by outliers. There are only a few clear things that seem to be happening here. First, “deep WDT” helps reduce the spread in peak resistance, and perhaps increases the average peak resistance a bit, although this effect is quite diluted by variations in my puck preparation technique. Second, the paper filters don’t clearly improve the situation, but they also seem to increase the overall puck resistance by about 7%. This is not too surprising, because the filter acts as an additional percolation layer, with its own hydraulic resistance that will contribute to increase the global resistance just a bit. In the last two groups to the right, I divided the resistances of the “paper filter” cases by 7% and combined them with the “no-filter” cases, to show all of the “surface WDT” and “deep WDT” shots together, whether I used a paper filter or not. Yet again, we see the effect of the drastically reduced median absolute deviation (blue vertical bar), and the slight decrease in standard deviation (red vertical bar). This tells us that the majority of shots are much better grouped together in terms of peak resistance, but that there are still a few shots that were very different.
Viewing the DE1 profiles for all “surface” vs “deep” WDT methods, regardless of paper filters, is also visually compelling:
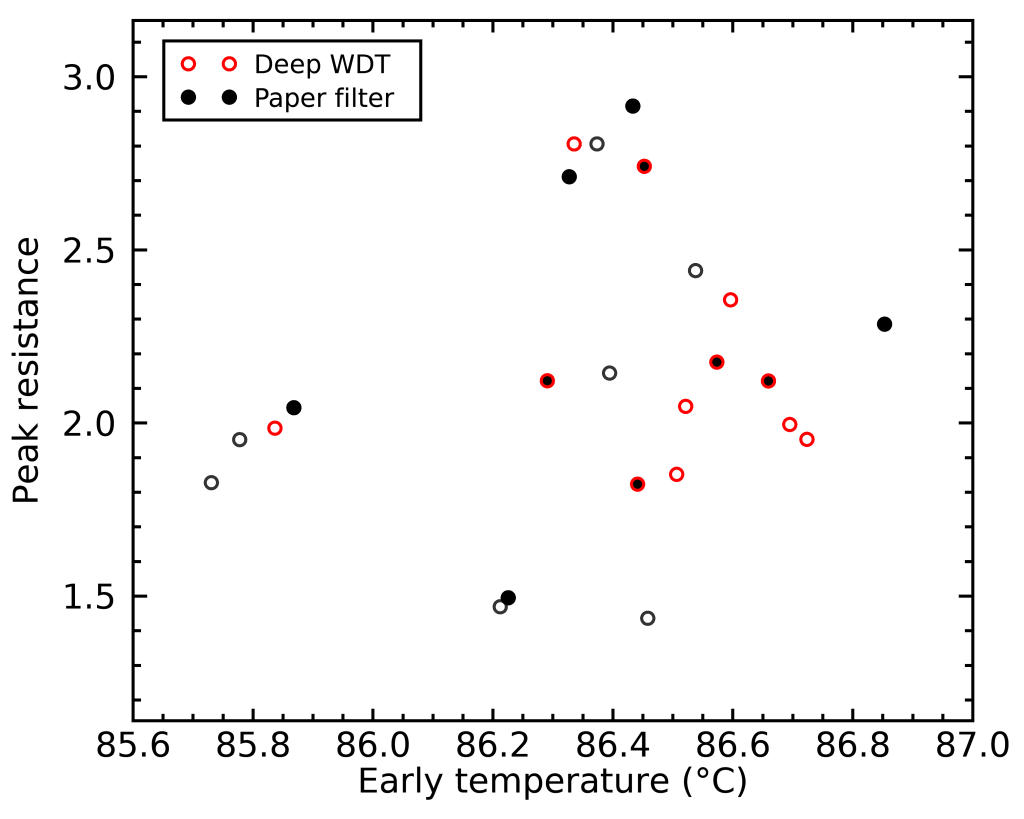
One thing I find particularly interesting about these data is that all of the outliers with the “deep WDT” method—about 15% to 25% of my shots—seem to be chokers (high resistance), not gushers (low resistance). Intuitively, I expect that mistakes in puck preparation will tend to leave low-density regions in the puck, or worse, small channels, which would both favor the occurrence of gushers. But something else seems to be happening here, that causes these outliers. I have two hypotheses for this: (1) my distribution of coffee grounds in the portafilter is generally really bad, and there were only a few cases where I had a very good puck preparation, i.e. the high-resistance cases above were the only great shots; or (2) another random but relatively rare process causes the puck resistance to go up—possibly some larger coffee particles clogging one or more holes in the espresso basket, or some coffee oil that I did not clean up perfectly from the last shot reduced the effective sizes of some of these holes. If the latter explains my observations, then adding a paper filter at the bottom of the puck should help reduce this effect, because blocking any portafilter hole would not affect the hydraulic resistance of the full system as much with a paper filter above it. Water could still go around the clogged hole quite easily by passing through the paper filer.
However, I have a slightly frightening suspicion that the true explanation is my terrible repeatability at distributing the coffee grounds in the portafilter. The reason is that I noted in my logs that some of these shots had a particularly beautiful even appearance of drips at the bottom of the portafilter holes, and a very clean and even flow of water, and they tend to correspond to the shots that had the highest peak resistances in the graph above. The more frightening aspect of this is that all 24 shots from the experiment looked ok visually; we are talking about minor visual differences here. If this is the explanation for the varied puck resistances, then it would mean puck preparation is absolutely unforgiving in terms of how much the peak resistance varies from one shot to the next. While deep WDT seems to improve the general picture by eliminating most of the worst gushers, it did not seem to improve the rate at which I obtained these higher-resistance shots. This would mean that doing deep WDT helps us to avoid the worst shots, but also that no style of WDT really fixes underlying problems in ground distribution during grinding. This also calls for future experiments to test more methods of ground distribution.
Another fact that hints at an imperfect distribution is the following: all of the shots that I pulled for this experiment, including those with a paper filter at the top, yielded spent pucks that were slightly more hollow near the center:
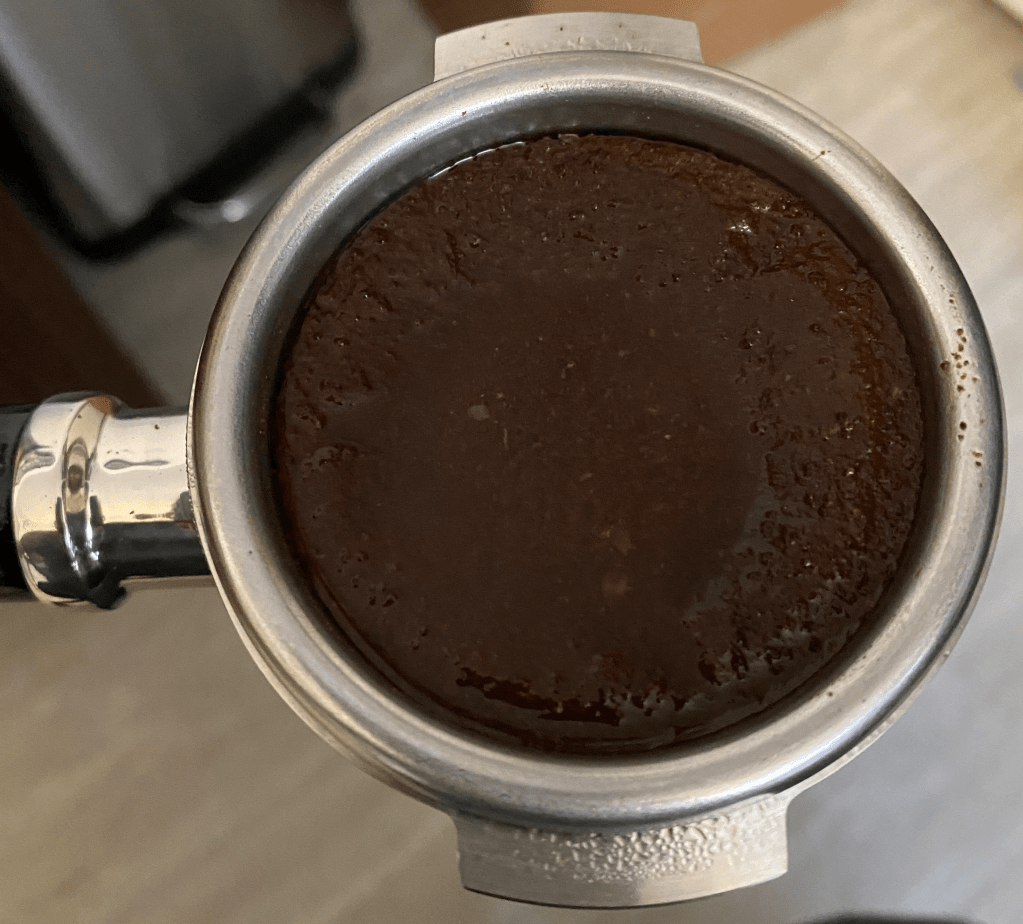
The fact that this happened even with a paper filter at the top suggests that this was not caused by the shower head damaging the top of the puck. Rather, it might indicate that the way I distribute grounds onto the portafilter with the circular motion leaves a lower density near the center of the puck. I did a quick test of this by grinding one more shot as a mound into the portafilter and then using the deep WDT method, and the spent puck was indeed much less hollow at the center. Another way to completely fix this problem is to add a paper filter below the puck.
Now, the wide variations in peak resistance that I observed above are not particularly great news for the adaptive profile that I created for the DE1 in my last post. These adaptive profiles try to go around imperfect dial-in in grind size by adopting whatever flow occurs at peak pressure, which means that they rely on the peak resistance to decide what is the best flow for the rest of the shot. In other words, all of the shots in this experiment, which used the exact same grind size, would have yielded flow rates that varied between 1 mL/s and 2 mL/s, and generated quite different styles of beverages. A straight flow-controlled shot with a pre-determined flow rate would be even worse, however; these variations in bed resistance would be reflected in variations twice as large in pressure, and would have caused some of these shots to choke or stay at extremely low pressures, both of which seem to yield quite bad-tasting shots, instead of just different styles of shots.
More typical profiles like the “Best Pressure Profile” seem more forgiving in that regard, and this is because even though they start at wildly different flow rates, they seem to converge to more similar flow rates near the end of the shots, as the puck resistances converge to values which do not vary as much from shot to shot. This convergence effect means that the average flow during these pressure-profile shots do not vary as much, and the shots probably taste more similar as a consequence. I have indeed tasted most of these 24 shots above, and while some were definitely better than others, they mostly did not taste wildly different.
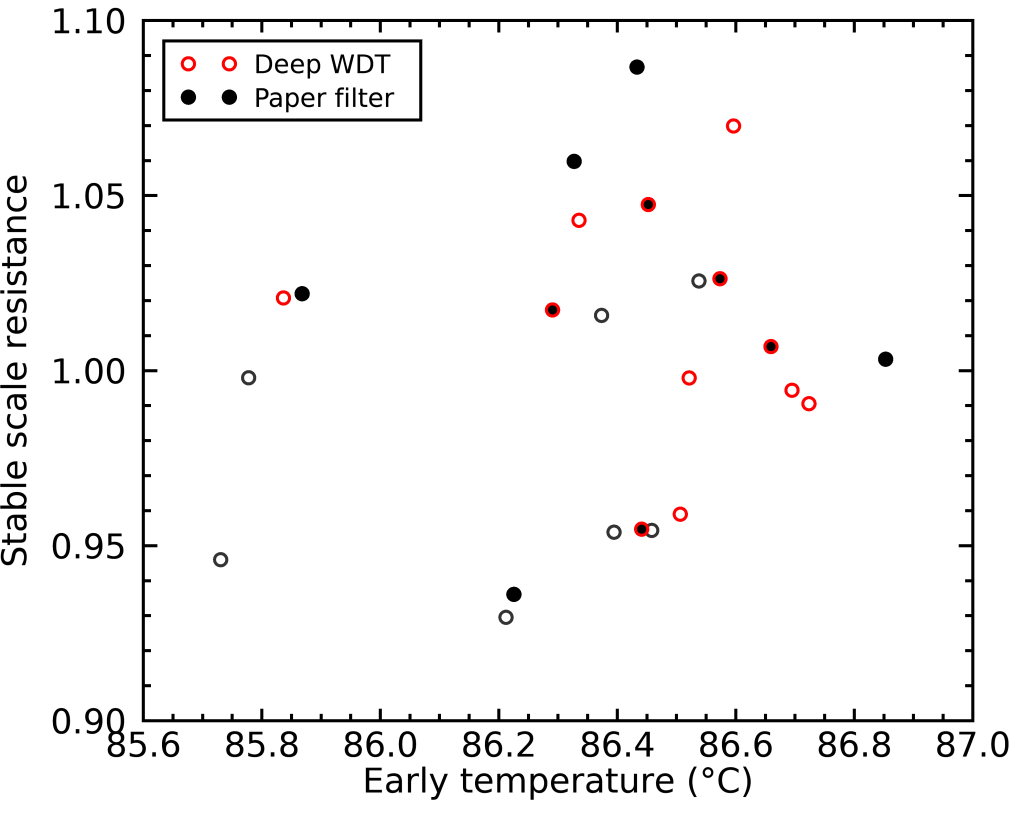
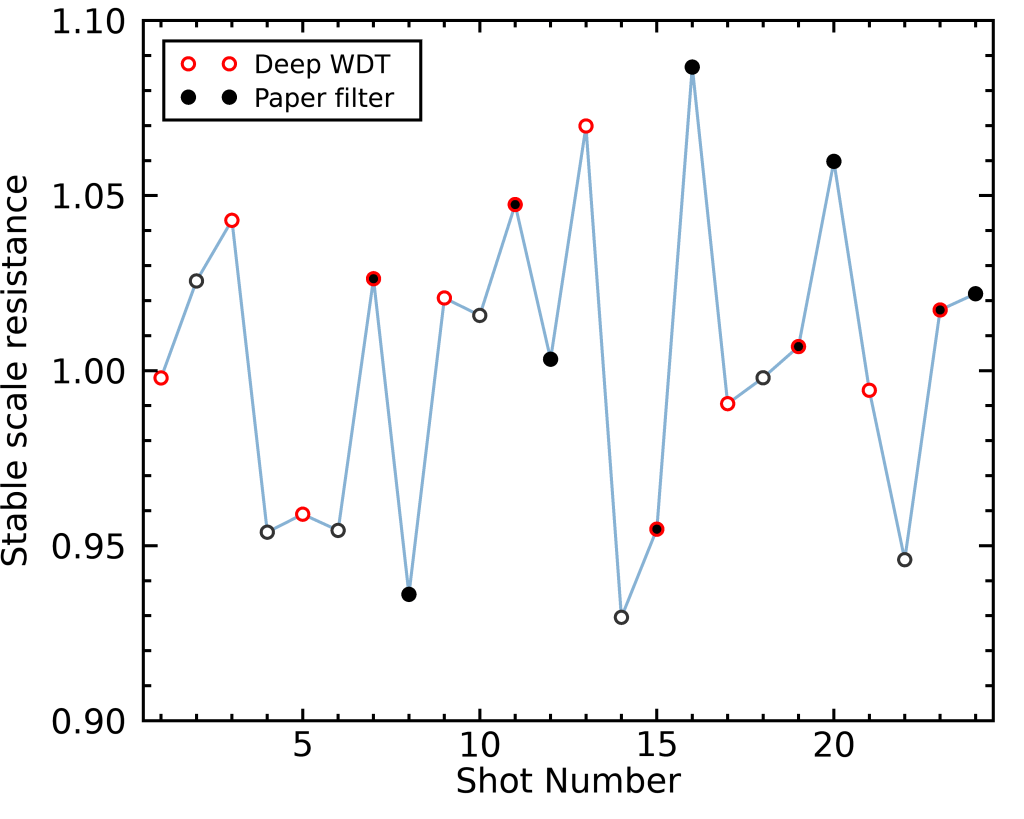
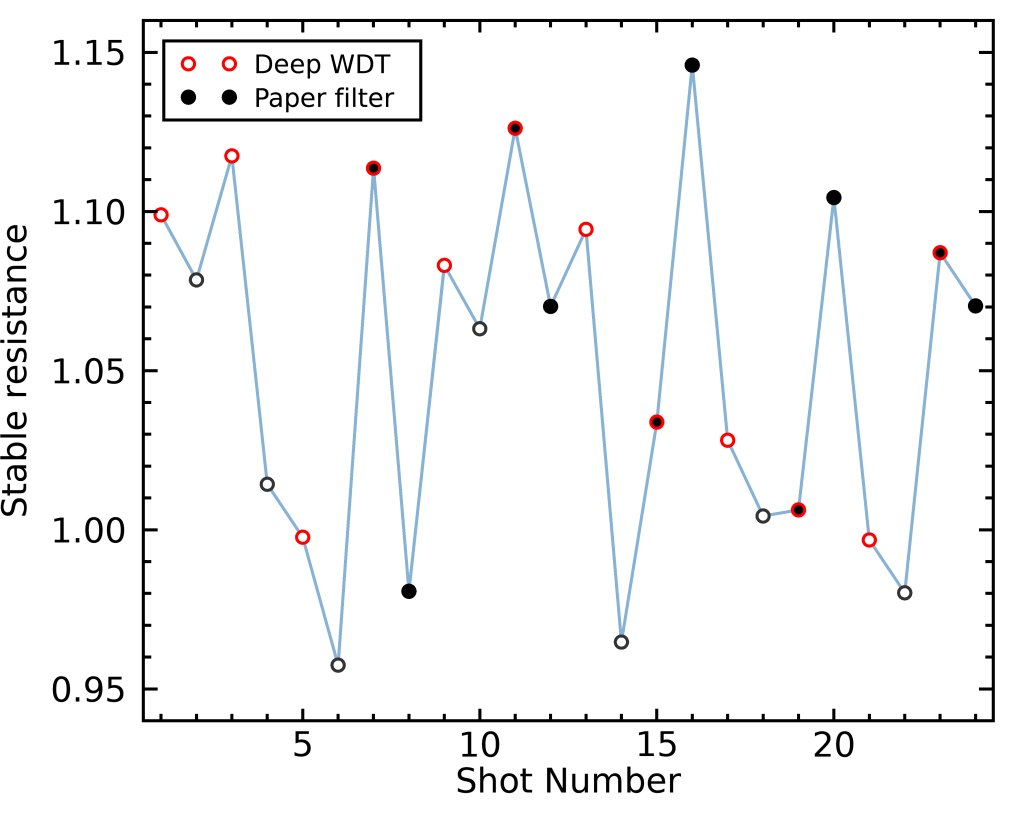
One way we can better characterize this convergence of puck resistance is by looking at the stabilized value near the end of the shot. To do this consistently across all shots, I chose the moment where any shot reached a beverage weight of exactly 40.0 grams, and compiled the puck resistance at that moment. You can see that the results, below, show much less variations, and also less dependence on the puck preparation technique:
The figure above lists the end-of-shot resistances as calculated from the yellow curves (based on the flow rate at the shower head). I made a similar figure by using instead the probably more-reliable puck resistances calculated from the Acaia Lunar scale:

Here, we seem to observe a slight improvement in repeatability when using both a top paper filter and the deep WDT method.
I believe that these data are all a strong indication that the standard DE1 preinfusion is insufficient to reach saturation of the puck before we actually start extraction. I think this is the cause for less overall repeatable shots, and probably for much less even extractions as well. This potentially has even more impact on my adaptive profiles because they rely on a moment where the puck is not yet saturated to determine what the optimum flow rate should be for a given shot.
I think that repeating this experiment with a short pause after preinfusion, or even a blooming profile that then mimics the pressure curve of the “best pressure profile”, would yield much more consistent shots.
So, what are my conclusions this unusually long post, even by my standards?
- My shots show variations of about 5% in terms of puck resistance near the end of the shot. This is comparable to the kind of resistance change one would expect from adding or removing 1 gram from a 18.0 grams dose. I do not know yet what this corresponds to in terms of grind size, but it indicates that I have to be careful in concluding that any small changes in puck resistance was caused by something else than random variations in my puck preparation.
- When I use the surface WDT method, my shots show significant variations in peak resistance, by about 40%. This means that using surface WDT will cause wide variations in flow rate when using the adaptive profiles. As a consequence, I will keep using the “deep WDT” method for now.
- Using a paper filter on top of the puck does not seem to significantly improve the repeatability of my shots, nor does it improve the hollows that often form at the center of my spent pucks. It is still possible that the top paper filter improves the average extraction yield and/or the flavour, so I have not yet made up my mind about whether I should keep using the top paper filter.
- This experiment taught me that I need to keep working on how I distribute the coffee in my portafilter while grinding. As a consequence, I will keep experimenting with other methods in the near future.
- This experiment tells me that current preinfusion steps in most of the DE1 profiles are insufficient to fully saturate the puck before extraction. I will therefore experiment a bit to determine how I can improve preinfusion and I will revamp the adaptive profiles very soon.
For those who are interested, I made my log publicly available here for the 24 shots used in this experiment. I also zipped all of the DE1 data files from my 24 shots with the “best pressure profile” here. I also generated 7 more figures to diagnose my data and make sure that no further systematics affected my peak resistance curves; for instance to ensure that variations in preinfusion temperature preinfusion duration or the shot order did not cause issues. I made those figure available here for the more technically minded readers. I also posted them at the end of this post below.
Disclaimer: I receive no financial benefits from any of the companies mentioned above, and I have no business ties to them. Decent Espresso generously offered me a 25% discount on their DE1 machine, and Weber Workshops offered me a set of SSP Ultra-low-fines burrs and their glass cellars, without obligations or expectations. All my impressions of the gear that I use are my own and never financially motivated. The owner of color/full is a personal friend.
I would like to thank Johanna “Mimoja” Amélie Schander for having coded the required Bluetooth communication codes on the DE1 and making it possible to pair the DE1 with Acaia scales.


As a Decent owner this is so helpful! Thank you very much. Looking forward to more posts like this.
LikeLike
Have you thought of using the Duomo WDT tool? May make your deep WDT process more repeatable for experimentation.
LikeLike
I haven’t ! I’m a bit worried about the Duomo’s fixed needle positions, I suspect it’s not as effective as manual WDT unless it would have a lot more needles at different positions.
LikeLike