Now that I have outlined the method by which I pull espresso shots with the EG-1 grinder and SSP ultra-low-fines burrs (or ULF burrs for short), I thought it would be interesting to compare them with a more classical espresso grinder like the Niche Zero. I do not yet have great data to show you exactly how the particle size distributions of these two grinders differ, because doing so will require measuring the very-fine coffee particles down to a dozen microns in size, something extremely hard to do with imaging methods like my grind size application. Sifting might sound like a good method for this, but it is also impractical because, without a jet of pressurized air, fine particles tend to stick to larger ones, making it really hard to measure their contribution using sieve sets. Rather, I have plans to get some laser diffraction data for both grinders; it requires expensive machines, but it is a much better solution to detect the differences in how many fine particles different grinders generate.
We will see in this post how the differences in the shot characteristics between the two grinders strongly hint at a very different quantity of fines. You may recall from one of my earlier posts that a quantity often called D10 drives the hydraulic resistance of a coffee puck (i.e., how much it resists flow at a given pressure). Simply put, D10 is the size of the particle that you would encounter at 10% of the total dose weight if you sorted every particle by increasing weight. If we used D50 instead, and stopped at 50% of the total dose weight, we would get something called a “median” particle size (ordered by particle weight); it may be surprising that D10 and not something closer to D50 drives the puck resistance, but that is a consequence of fines having a disproportionate role in affecting the resistance.
With this in mind, you can understand how using a grinder that generates less fines will require grinding much finer overall to overcome the otherwise reduced proportion of fines, and obtain a similar puck resistance. I find it easiest to see this difference visually when inspecting the spent puck of a an SSP ULF shot (top panel below) to that of a Niche shot (bottom panel below), dialed in for similar puck resistances. In these photos, we can clearly see how the particles in the Niche spent puck are much coarser on average. I think it’s easier to see this effect in a spent puck because the fines get washed away to the bottom of the puck and in the shot of espresso, so we can more clearly see the coarser particles that remain. The SSP ULF shot at the top looks more like a uniform brownie, except where I damaged it when removing the filter paper.


For today’s comparison, I decided to pull as many shots as I could in a row with the set amount of time I had, alternating between the EG-1 + SSP ULF and the Niche. I always alternate between methods with I do such comparisons, to account for anything that may evolve during the experiment, like the overall temperature of the set-up or my puck preparation changing because I am getting tired. I used a washed Colombian coffee named Asotbilbao. It is a mix of Caturra, Castillo and Colombia varieties grown at 1600-2000 m.a.s.l. in Planadas, Tolima, roasted by Andy Kyres about two weeks before I ran the experiment. A few days after it was roasted, I vacuum-sealed and froze the coffee, and I let it thaw completely before I started the experiment.
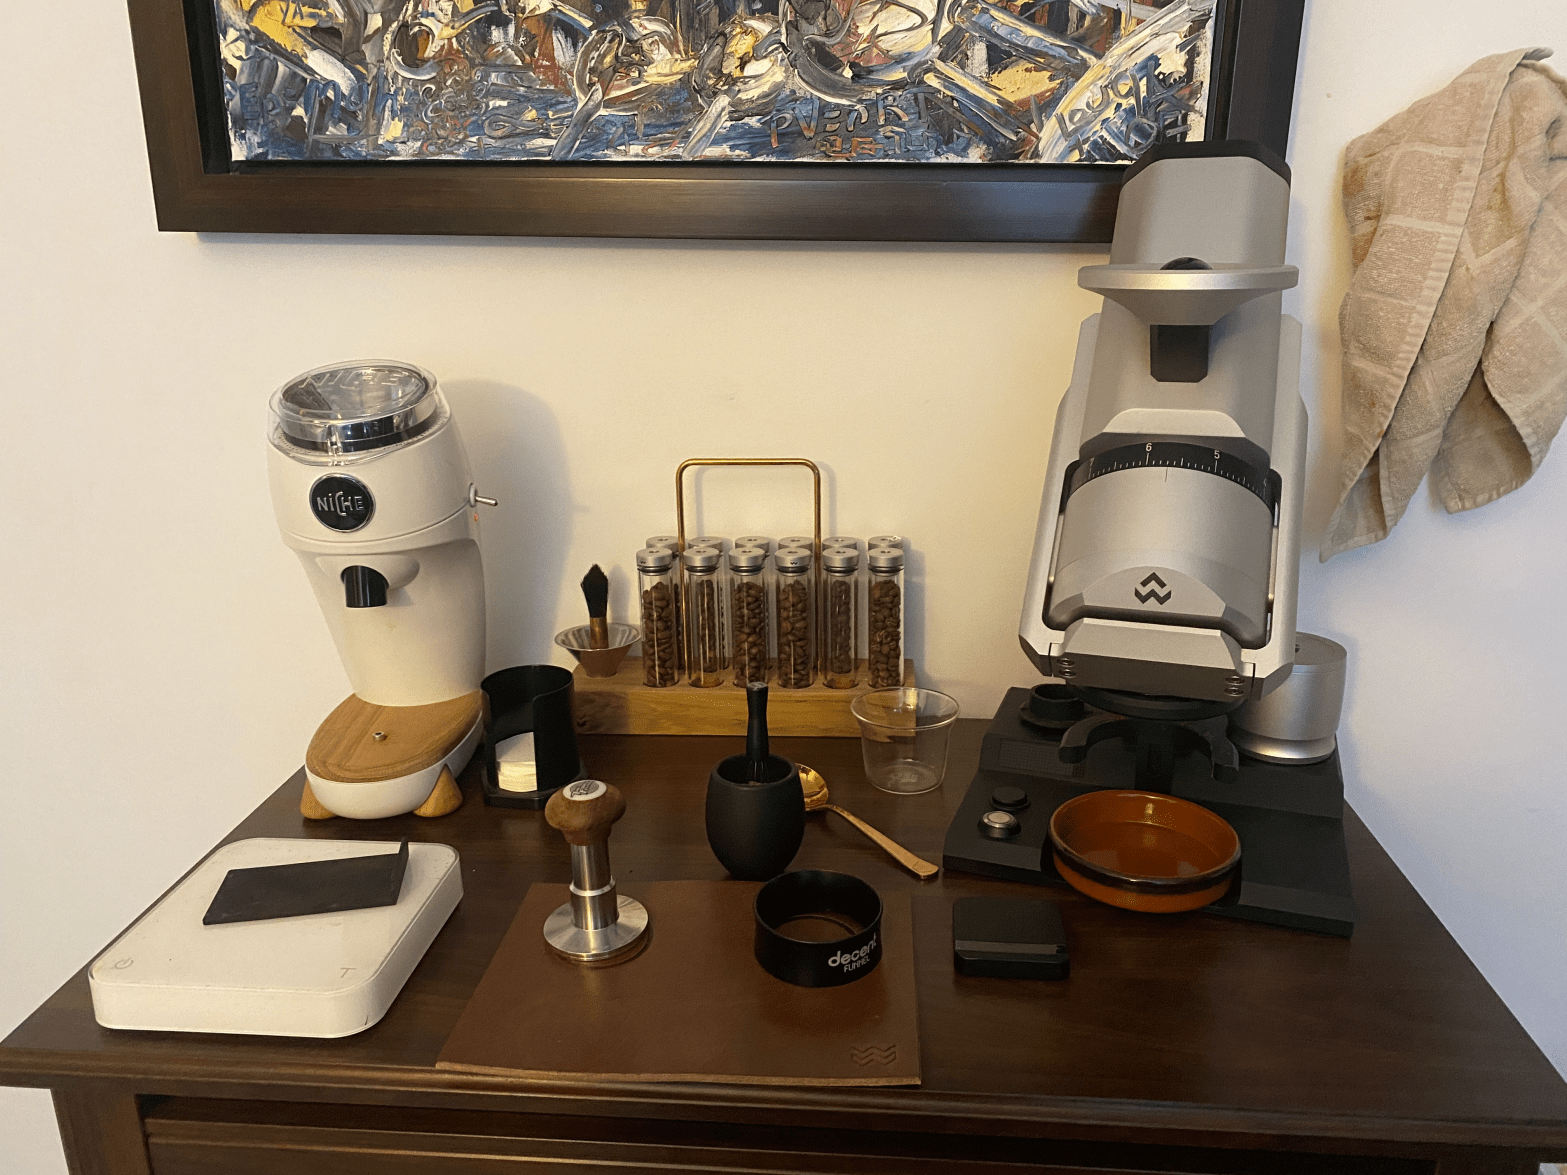
I used a similar setup than my latest few experiments; namely, the deep WDT method described in this post with Levercraft’s WDT distribution tool, one cafelat robot filter below the puck and one above the puck (as described here) with the creped sides against the coffee puck. When grinding with the Niche, I used the distribution technique shown here and inspired by Scott Rao. When grinding with the EG-1 + SSP ULF burrs, I used the methodology that I detailed in my last post about low-fines espresso shots. I used the Force Tamper, and the DE1+ Decent espresso machine with the IMS shower head and the Decent 18g basket.
I chose to use the blooming espresso profile developed by Scott Rao for the DE1, with a 1:4 ratio. I chose this particular combination in order to focus on how the puck resistance would evolve after a thorough, 30-seconds preinfusion that ensures no part of the change in puck resistance during the shot may be caused by the puck still becoming wet. After experimenting with my adaptive profiles, I have concluded that the puck not starting fully wet at the end of preinfusion was likely a significant part of what drove the quick decrease in puck resistance at the start of my shots, regardless of the grinder. Using a blooming profile therefore allows me to remove this variable of puck dryness entirely, and to see how the puck resistance evolves in time due to other factors. The choice of a 1:4 ratio may sound surprising: it will reduce any contrast between the average extraction yields of the two grinders, because the additional water will bring all coffee particles closer to being completely extracted, but it will also allow me to better see where the puck resistance stabilizes after a longer shot time. This is a compromise I was willing to make for this experiment.
Before I started the experiment, I let the DE1 warm up for about 15 minutes with the portafilter in, and I then dialled in the Asotbilbao with both grinders. I landed on grind size 10.0 on the factory-zeroed Niche, and 4.7 at 1500 rpm on the EG-1. I let both grinders at these respective grind settings for the whole experiment without touching them again. I ran one test shot with each grinder during dial-in, and I then landed on a dialled-in EG-1 shot for my third overall shot. The fourth shot on the Niche was still not dialled in, and the fifth overall shot ended up serving as my first dialled-in Niche shot. I mention this because it may be relevant for temperature stability; I often find that it takes two or three shots before the machine and portafilter all come to their peak temperature stability. In the further discussions of this experiment, I only numbered and considered the shots that were dialed in. All in all, I managed to pull six EG-1 shots alternated with five Niche shots after the dial-in step.
After every shot, I stirred the coffee with a clean spoon, and I sampled a few grams with a clean, numbered pipette. I emptied the pipette and then collected a sample again, to minimize any possible contamination, and I placed the pipette on a flat surface for an hour or so. I decided to collect all samples first during the experiment, and to let them cool in their respective pipettes while I was running the rest of the shots and cleaning up afterwards. I then started measuring them with the VST refractometer while not paying attention to the randomly assigned pipette numbers, which made the measurements blind with respect to what grinder they corresponded to. This also allowed the samples to reach room temperature before they touched the refractometer prism, a crucial point when measuring total dissolved solids or TDS, as I talked about here.
I then put the full sample on the refractometer, immediately took one “raw” measurement, sampled a drop or two back in a VST syringe, emptied the syringe and then sampled the rest of the coffee directly from the refractometer into the syringe, again to minimize any possible contamination. I then pulled the syringe piston all the way back, inserted a brand new VST syringe filter, and slowly pushed the piston until I had obtained few filtered drops on the refractometer prism. Before every raw or filtered TDS measurement, I cleaned the refractometer prism with alcohol, and I zeroed the refractometer with room-temperature distilled water before every pair of raw and filtered measurements.
I realized something important about measuring espresso TDS when carrying this experiment. I knew that TDS readings usually keep creeping up when measuring raw samples, even when they were allowed to reach room temperature, and I had always attributed this to undissolved coffee fines depositing on the surface of the refractometer prism. I was surprised to notice that this also happened with the VST syringe-filtered samples, albeit to a much lesser extent. In fact, I came to the realization that this is especially a problem when using a sample larger than 2-3 drops. I previously allowed myself to use larger samples because I had let them cool to room temperature before they ever touched the refractometer prism, but a larger sample has a lot more fines that can deposit on the refractometer prism. During the whole experiment, I always measured the TDS immediately after placing the sample on the prism and those are the measurements that I ended up adopting, however it is only after the sixth overall measurement that I started to use only three drops with the VST-filtered sample, which completely eliminated any change in TDS with subsequent measurements. As a consequence, I have adopted a measurement error of ± 0.03% TDS for the filtered samples before I started using smaller 3-drop samples, which is about the amount by which they went up in the first 15 to 20 seconds. For the remaining filtered measurements, I adopted a measurement error of ± 0.01% TDS.
I made my log files publicly available here; I also placed my 11 DE1 shot files in a zipped package here. Now, let’s discuss the results.
First, I want to talk about the DE1 graphs. You may recall that blooming shots are flow-controlled profiles, which means that the DE1 tries to maintain a constant 2 mL/s flow of water at the shower head, and adjusts the pressure accordingly. Usually, this means that the pressure initially peaks ideally somewhere in the range of 4—8 bars, and then slowly decreases as the puck resistance goes down. This is what this looked like with the Niche:

The puck resistance curves (either calculated from the shower head flow in blue or from the Acaia scale measurements in brown) go a bit crazy during the bloom; that’s perfectly normal and I don’t consider that the resistance curves are very useful in that phase. You can see that the pressure curves rose to about 5 bar and gradually declined. One shot showed way less puck resistance, and thus less pressure, probably because of an inconsistency in my puck preparation. The EG-1 + SSP ULF shots looked like this:

We can observe similar pattern here, where each shot peaks near 5 bar, but this time there is one outlier where the puck resistance was higher instead of lower. If you look carefully, however, you will notice that the rate at which the pressure decreases is quite different with the EG-1 shots. Here’s another look at the same pressure curves, but normalizing the shots to each grinder’s respective median peak:

Here, we can see something really interesting: All of the EG-1 shots saw their pressure curves decline much faster, and the Niche shots had a pressure curve that declined more gradually. Because I used a 30-seconds bloom in these shots, the loss in puck resistance is likely not related to the puck gradually becoming wetter. I am also very skeptical of the usual claims that the puck is “losing integrity”, falling apart or developing many channels, because similar experiments where I pulled shots to 1:11 showed no evidence of further degradation in puck resistance. In fact, the two spent puck photos that I showed further above were from these other tests with a 1:11 ratio. Maybe the puck would actually fall apart with doses much below 18 grams and/or bad puck preparation, but with all the shots I am testing here, the spent pucks seemed to remain in very good condition, and I think that massive channeling is not a good explanation.
This leaves me with few viable hypotheses to explain the decrease in puck resistance. I think it is most likely that a loss in the slurry’s viscosity as it becomes less concentrated makes the fluid more able to flow through the puck as it becomes clearer. This would also naturally explain why the SSP ULF shots decline much faster than the Niche shots; having had to grind much finer, all particles of coffee are able to give out a lot more solubles faster, and their extraction also slows down faster because they each contain less stuff. Larger coffee particles start extracting slower, but they contain a lot of solubles hidden deep below their surface; these compounds take time to slowly diffuse toward the surface of the particles, and they keep leaking out for a longer time.
If you read one of my recent posts about puck preparation, I actually talked about this, and showed the following figure from a science paper by Sobolik et al. (2002) that describes how the viscosity of coffee changes with temperature and concentration:

At high water temperatures, a change of concentration in coffee solubles from 0% TDS (clean water) up to 10—15% TDS is sufficient to increase the fluid’s viscosity by 50% according to their data. The exact numbers may depend slightly on the type of coffee, but I will be surprised if it changes by orders of magnitude. If we just use a simple interpolation of Sobolik et al.’s data, it therefore seems like a change of viscosity from something above 10% TDS to something close to 0% TDS could account for changes in pressure by about a factor of two, in the right ballpark for what we are observing in the above shots. This depends on a few assumptions, however; coffee oils which I mostly ignored might play an important role here, and I used the rule-of-thumb relation where the change in pressure goes with the square of the puck resistance as observed by John Buckman and other DE1 users – I believe this is due to the porosity reducing when pressure increases, but the exact relation my deviate slightly from this. If you go back to the DE1 graphs, you will also notice that the actual flow rates measured by the Acaia scales gradually go down a bit as the pressure curve declines. This is likely due to small inaccuracies in the way in which the DE1 estimates the flow at the shower head (by just reading the pump voltages, which is genuinely crazy, so I don’t blame them). A small part of the pressure decline might certainly be explained by this miscalculation in flow, but we are talking about a ~20% decline near the end of shots, that cannot account for all of the full pressure decline.
Now, you might ask “why do we care what the underlying explanation is?” I think this matters, because it may be pointing us in the direction of something I very rarely hear, except recently when I saw another great experiment by Stéphane Ribes on the DE1 users forum: higher-uniformity burrs in general (and those that generate less fines) will give out their solubles a lot faster, and reach high extraction yields at shorter ratios compared to burrs with wider particle size distributions. When you think about it, this may actually be suggesting that using shorter ratios, not longer ratios, may be a sensible approach to these types of burrs, if we can appreciate much higher-TDS beverages.

In my experience so far, there is something that prevents any kind of espresso shots or allongés to taste good when they run for more than about 30 seconds (excluding preinfusion and bloom). This may be related to the increased amount of oils that are able to get into the beverage after this period of time; oil is much more viscous than water and takes some time to come out from the particles entirely. This observation could also be related to other, heavier chemical compounds more slowly leaking out into the beverage. Regardless, both of these interpretations would suggest that the finer-ground particles obtained with the EG-1 + SSP ULF burrs will also allow the less desirable stuff to come out faster than they do from the Niche particles, on average. If I were to stop one of these EG-1 shots at 1:2, I may be getting all the same good-tasting stuff as a 1:3 Niche shot, with less of the not-so-desirable stuff. Conversely, if I stop the EG-1 shots at 1:3, I may be getting a much higher average extraction yield than the Niche, but I might also be getting a lot more of the oils or less-desirable compounds, and maybe it would taste like something more comparable to a 1:5 shot on the Niche.
This may sound like I am saying that we should be targeting the same average extraction yields regardless of the grinder, but I don’t think this is true. In fact, even shots that I run at about 1:2.3 on the EG-1 + SSP ULF burrs seem to have higher average extraction yields compared with 1:3 shots on the Niche. However, I digress, so let’s get back to the results of this experiment.
Against my expectations, something really interesting happened with the temperatures of my shots during this experiment. First, let’s look at the average shot temperature versus shot number. We can see that, despite having preheated the machine for a while and having run test shots before the actual experiment, my first shot ran with a cooler 0.5°C average temperature, and the second shot was also slightly a bit cooler than average.

In the figure above, the two black crosses mark the shots that had outlier pressure curves in the DE1 graphs, and the horizontal dashed lines show the averages for each grinder. The shaded regions show the typical spread of each grinder (their standard deviations). Another thing jumps out of this graph; the EG-1 may be producing just slightly cooler shots on average. When I saw this, I wasn’t sure it’s not just a statistical happenstance, and I decided to zoom in on the DE1 temperature graphs, shown below.

In this figure, the black lines represent the “goal” temperature of the DE1. The blue lines represent all of the EG-1 shots, and the red lines represent all of the Niche shots. I used dotted curves to represent the first shots with both the EG-1 and Niche. If you are not used to the DE1 you may wonder why the actual curves are so different from the temperature goals. This is perfectly normal, and it has to do with the fact that the bloom phase in the 10—40 seconds range has no flow, so there is no new water added to the slurry to actually reach the lower temperature goal. No, there isn’t a tiny fridge inside the DE1 group head in order to cool it without adding more water. When the shots start flowing again at 40 seconds, cooler temperature is added to reach the last 92°C goal, and the slurry temperature gradually cools down to meet the goal.
The part I find the most interesting about these curves is that the EG-1 shots did not seem to struggle to reach the initial 97.5°C temperature goal significantly more than the Niche shots. Rather, something happened during the blooming phase where the EG-1 slurries lost their temperature faster! There are two possible explanations for this: either the Niche heats up the grounds a whole lot more than the EG-1 does, or this is yet another consequence of the finer coffee particles produced by the EG-1 at espresso dial-in. The smaller particles provide a lot more surface area for heat to be exchanged from the slurry to the coffee particles, which means that the inside of the coffee particles will heat up faster with the EG-1 shots, and therefore drag the slurry temperature down faster. I plan to verify this with a simple experiment: all I need is to wait 10 minutes after grinding with neither the DE1 or portafilter preheated, to make sure that both the EG-1 and Niche pucks start at room temperature. If the particle size distribution is the underlying explanation, this effect will still be there; if the difference comes from heat transfer during grinding, the effect will have disappeared completely.
The dynamics of how chemicals extract from coffee particles is affected by both particle size and the slurry temperature, so I am not sure that these data immediately warrant bumping up the start temperature of low-fines shots, but it would be really interesting to try it and see what happens to the taste compared with regular blooming shots on the Niche.
Another cool thing I noticed during this experiment is that all of the low-fines shots had way less crema than the Niche shots, and when any crema was visible, it disappeared a lot more quickly. This observation does not seem to correlate much with pressure, because even the Niche shot with a very low pressure had significantly more crema than the low-fines shot with the most pressure. Even though the pressure of the low-fines shot decreased faster, it still had a higher pressure during the full shot!


This indicates that the presence of coffee fines in the espresso is probably an important ingredient in maintaining the stability of crema. Like everyone, I think crema looks beautiful, but this doesn’t necessarily mean that it tastes good, and in fact it has often been reported to taste quite harsh and bitter by itself.
Now, let’s see how the average extraction yields compared between the two set-ups. First, let’s look at the those calculated from the unfiltered, raw samples (i.e., the “Instagram” extraction yields):

We can already see a very clear trend, where EG-1 shots extracted much higher despite the high 1:4 ratio used in this experiment. The measurements based on the VST-filtered samples show a similar trend:

Yet again, the low-fines shots had a significantly higher average extraction yield. The average “raw” extraction yields were respectively 26.8% ± 0.2% for the EG-1 and 24.8% ± 0.1% for the Niche (a difference of 2.1% ± 0.3%), and those in the VST-filtered samples were 24.1% ± 0.3% for the EG-1 and 22.7% ± 0.2% for the Niche (a difference of 1.3% ± 0.3%). This difference should only get larger when using gradually shorter ratios.
This fits in perfectly with the picture that EG-1 + SSP ULF shots are generating much less fines, and therefore requiring me to grind with smaller average particle sizes. It also fits with my current interpretation of the different pressure declines, and the different temperature declines during the bloom phase. I was, however, quite surprised that the difference got less pronounced after having VST-filtered the samples. I expected the VST filtration to be removing less stuff because the low-fines shots should contain less fines in the cup. My current working hypothesis to explain this is that there is also a difference in oil content. Most likely, the finer particles of the low-fines shots allow oils to come out easier with a fixed ratio. Because oils tend to have a much higher refractive index than water or coffee, this may have thrown off the unfiltered TDS readings more so than undissolved fines did.
I also noticed that the Niche shots seemed to drip more coffee into the glass during the same 30-seconds bloom (there is one shot where I forgot to note down the measurement):

I think this can still be explained from the coarser particles of the Niche, on average. The particles initially absorb water by the effect of capillary action, and the time it will take for this to bring water to the core of a particle goes up with the second power of the particle size. This means that a coarser particle will take a lot more time to absorb all the water that it can absorb. Conversely, I think the finer particles of the EG-1 pucks were able to absorb water more quickly and leave less of it available for dripping out.
One aspect where the Niche always shines is its low grind retention. In fact, its average retention (0.18 ± 0.04 g) was a bit better than the EG-1 when the latter is used with the SSP ultra-low-fines at 1500 rpm (0.23 ± 0.02 g):

From my experience with the EG-1 stock burrs, I think they would have the same or maybe slightly less retention than the Niche does, especially if they are used at lower rpm, but the extremely fine-grinding requirements of the SSP ULF burrs require making this sacrifice in terms of grind retention. It is likely that suiting the EG-1 with a more powerful motor and operating the SSP burrs at this ridiculously fine grind setting with a low rpm would allow us to reduce the grind retention. This would also make the grinder even more expensive, however.
Quite interestingly, I noticed that the WDT step also caused 0.06 ± 0.03 g retention on average, and the tamping step with the Force Tamper also caused an additional 0.10 ± 0.01 g retention on average. This is a slight annoyance I have with the Force Tamper, especially given that it’s not very practical to clean it up entirely between shots.
When I thought I was almost done writing this post, I decided to go a bit deeper in testing how plausible it was that the decline in viscosity may explain all of the decline in puck resistance and pressure curves. To do this, I used DE1’s live temperature, flow and pressure data from each shot to estimate the puck resistance, and interpolate the Sobolik et al. relations of viscosity versus TDS (extrapolated in log space to higher temperatures), to obtain a live graphed estimate of the TDS that comes out of the DE1, if viscosity were the sole responsible for changes in puck resistance:

By multiplying these TDS curves with flow, and calculating the cumulated total of extracted solids, I was also able to build extraction yield curves:

Because the change in puck resistance only tells me about a relative change in viscosity, I had to make a guess at what value the TDS curves ended at, near the end of each shot. I decided to choose whatever value would make the end of the extraction yield curve meet with the actual VST-filtered measurement for each shot.
Now, the point of this was not to make a precise estimate of what I think the TDS really was, but rather to see if the numbers on these curves looked realistic… and they indeed do! The shapes of the extraction yield curves even look like what one would expect for the washing out of solubles leaking out of coffee particles, and like what Stéphane actually measured with different shot ratios in his figure further above. I did try to measure the TDS at the end of one of my shots for a coffee that extracts similarly as the Asotbilbao, and I obtained a value of about 2.0% TDS, in the ballpark of what these curves predict.
This experiment makes me want to try blooming shots with the EG-1 + SSP ULF at slightly lower ratios, and see if I like them. It also makes me want to try a more drastically decreasing shot temperature after the bloom, and see what happens. Reaching much cooler temperatures near the end of a shot could outset the loss in viscosity due to the change in TDS; it would also reduce how aggressive the extraction is near the end of a shot, where I suspect we don’t want to extract too fast anyway. How weird would it be to pull a flat-pressure, flat-flow shot?
All the realizations that came with this experiment also help me put things in perspective, and indicates that the much finer average particle size is probably the source of so many of the differences between the two styles of espresso shots. This would also back up the claim that we often hear in the espresso community, about low-fines (or high-uniformity) shots being less well suited for darker roasts, much like finer-ground coffee and higher brew temperatures are more suited to lighter roasts with filter coffee. I bet that using unusually low shot temperatures may produce good low-fines shots even with darker roasts, probably with less crema.
I also included a few more graphs below, but I don’t find them as interesting. They show that the EG-1 shots had lower puck resistances near the end, but that’s equivalent to saying that their pressure curves declined faster. They also show that the peak resistances were relatively well aligned, but this is not surprising because this is the criterion I used (indirectly with the pressure) to dial in the two grinders.


One thought on “A Comparison between Standard and Low-Fines Espresso Shots”