I come back to my last experiment and explore whether the difference in gravimetric vs volumetric flow could be due to changing shot TDS.
A Comparison between Standard and Low-Fines Espresso Shots
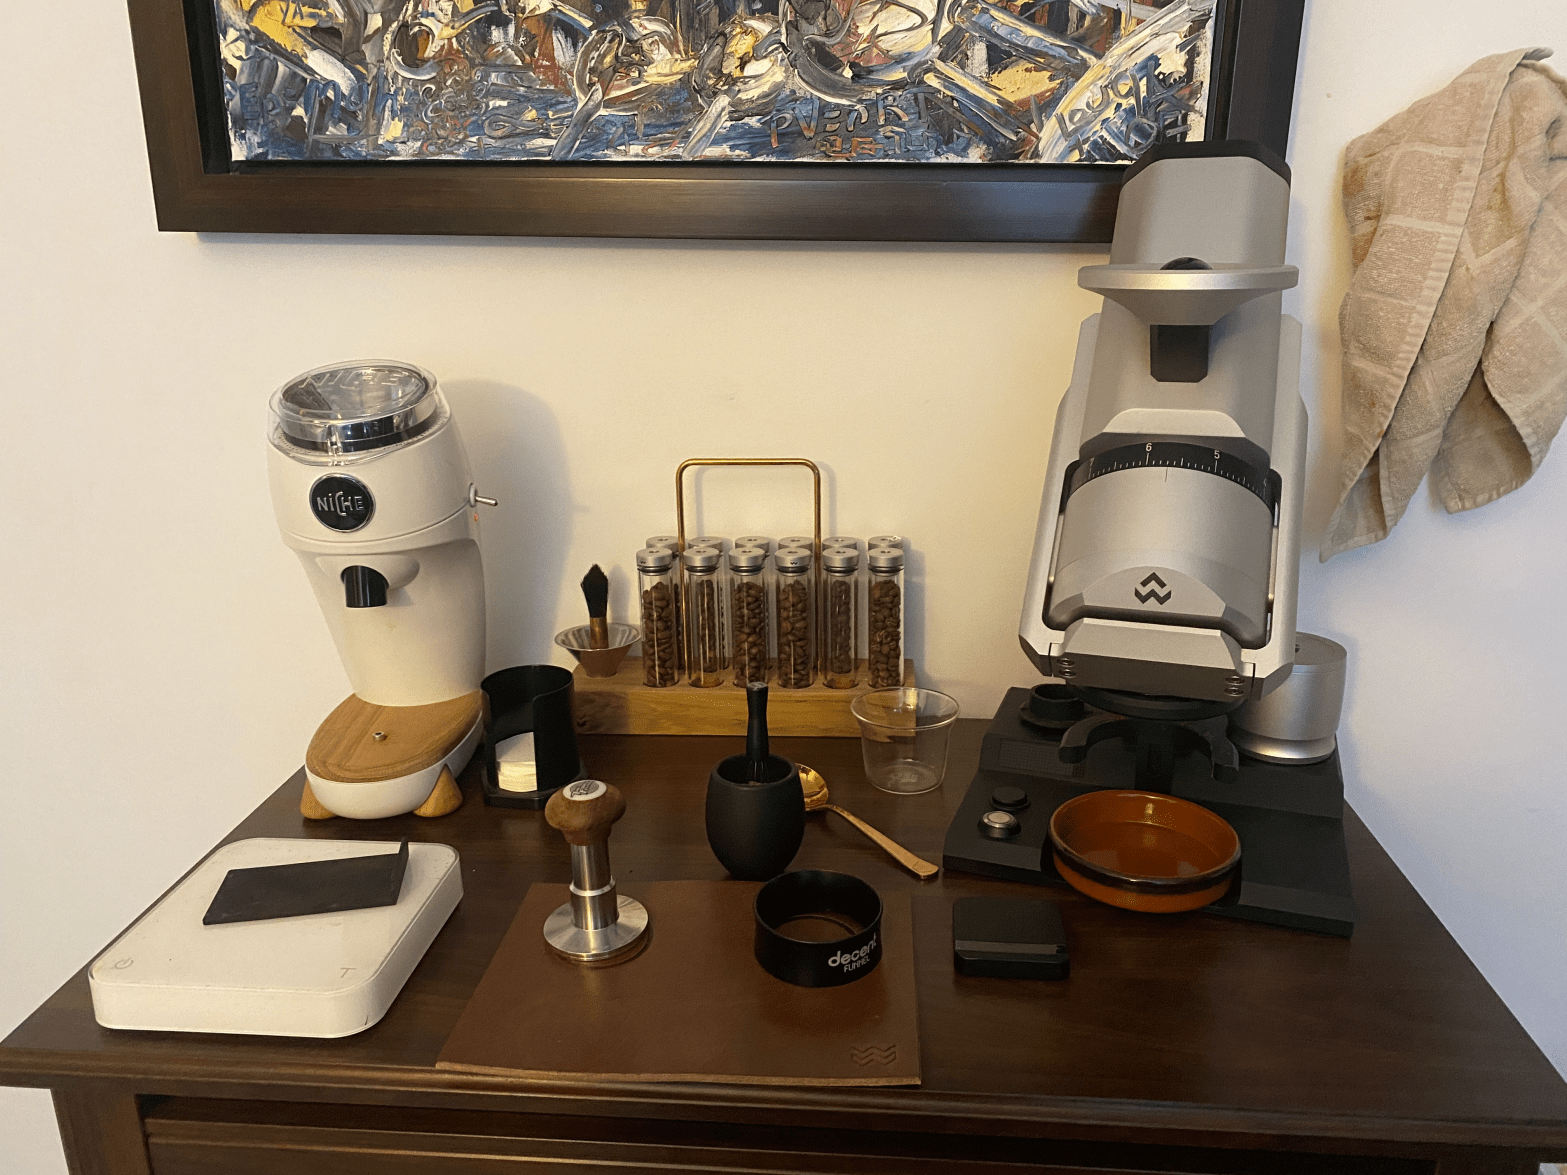
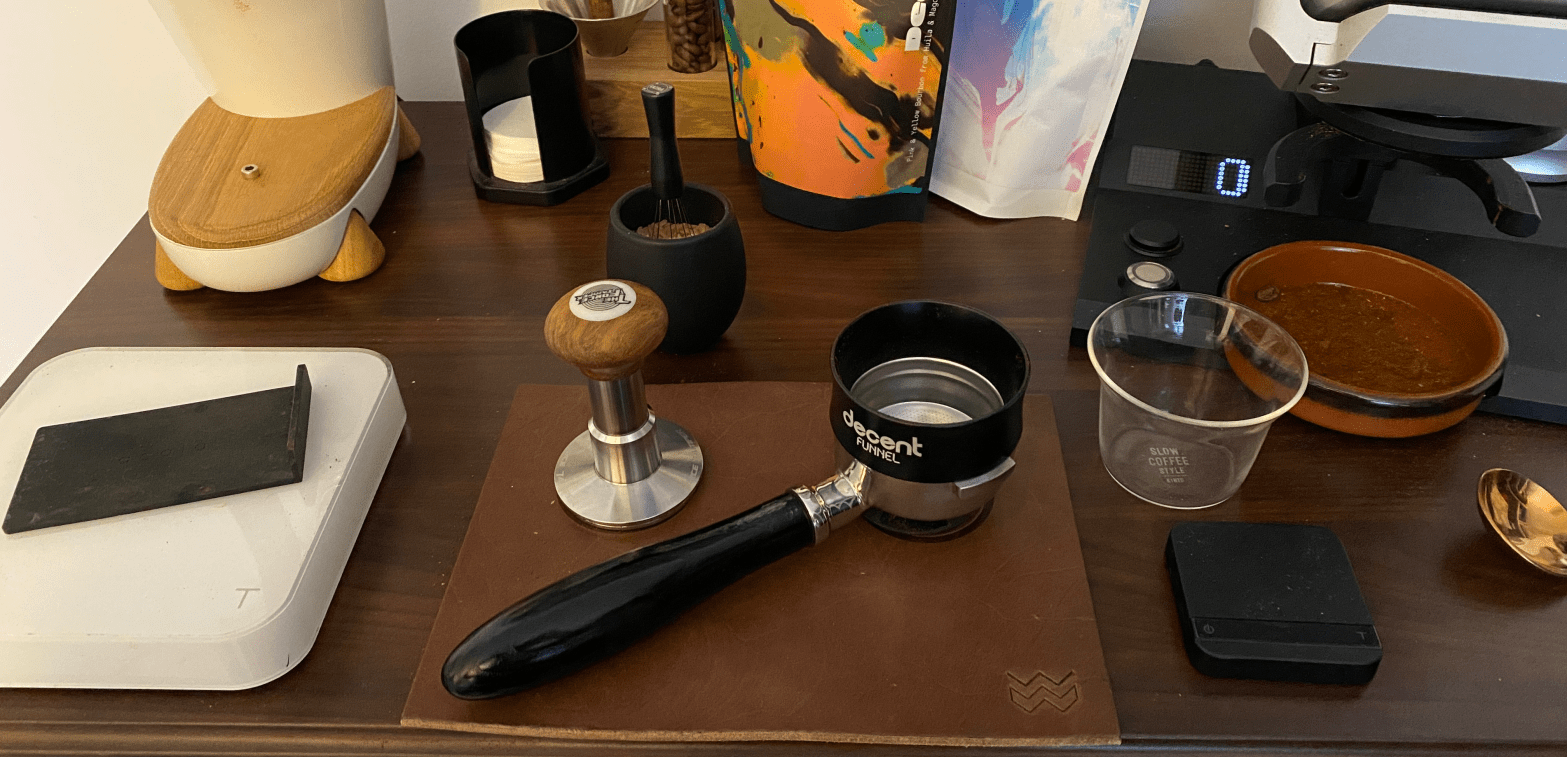
In this post, I compare several shots pulled with the Niche to others pulled with the EG-1 and SSP ultra-low-fines burrs.
Pulling Low-Fines Espresso Shots

In this post, I discuss how I pull espresso shots with the EG-1 grinder and SSP's ultra-low-fines burrs. These shots have a high average extraction yield, high clarity and low mouthfeel.
How a Paper Filter Below an Espresso Puck Affects Hydraulic Resistance

In one of my latest posts, I investigated the effect of puck preparation, and in particular the addition of a dry paper filter above the espresso puck, affects the hydraulic resistance of the system during an espresso shot. While I have not yet tested its effect on average extraction yield, I did not see anContinue reading "How a Paper Filter Below an Espresso Puck Affects Hydraulic Resistance"
The Four Rules of Optimal Coffee Percolation

In this post, I lay down four rules for optimal percolation that follow some of my most recent understanding about percolation physics.
A Study of Espresso Puck Resistance and How Puck Preparation Affects it
In this post, I present an experiment showing that deep WDT helps improve repeatability, and I discuss how to improve espresso preinfusion.
An Espresso Profile that Adapts to your Grind Size

In this blog post, I explore the possibility of a different way to profile espresso shots with the Decent machine to help dialing in faster.
Brewing with the Fellow Stagg [X] Dripper

In this post, I review why I completely switched from the V60 to the Stagg [X] brewer, and how I now use it.
The Effects of Varieties, Origin and Processing
In this post I discuss the effects of coffee varieties, origin and processing on average extraction yield and brew time.
The Physics of Kettle Streams
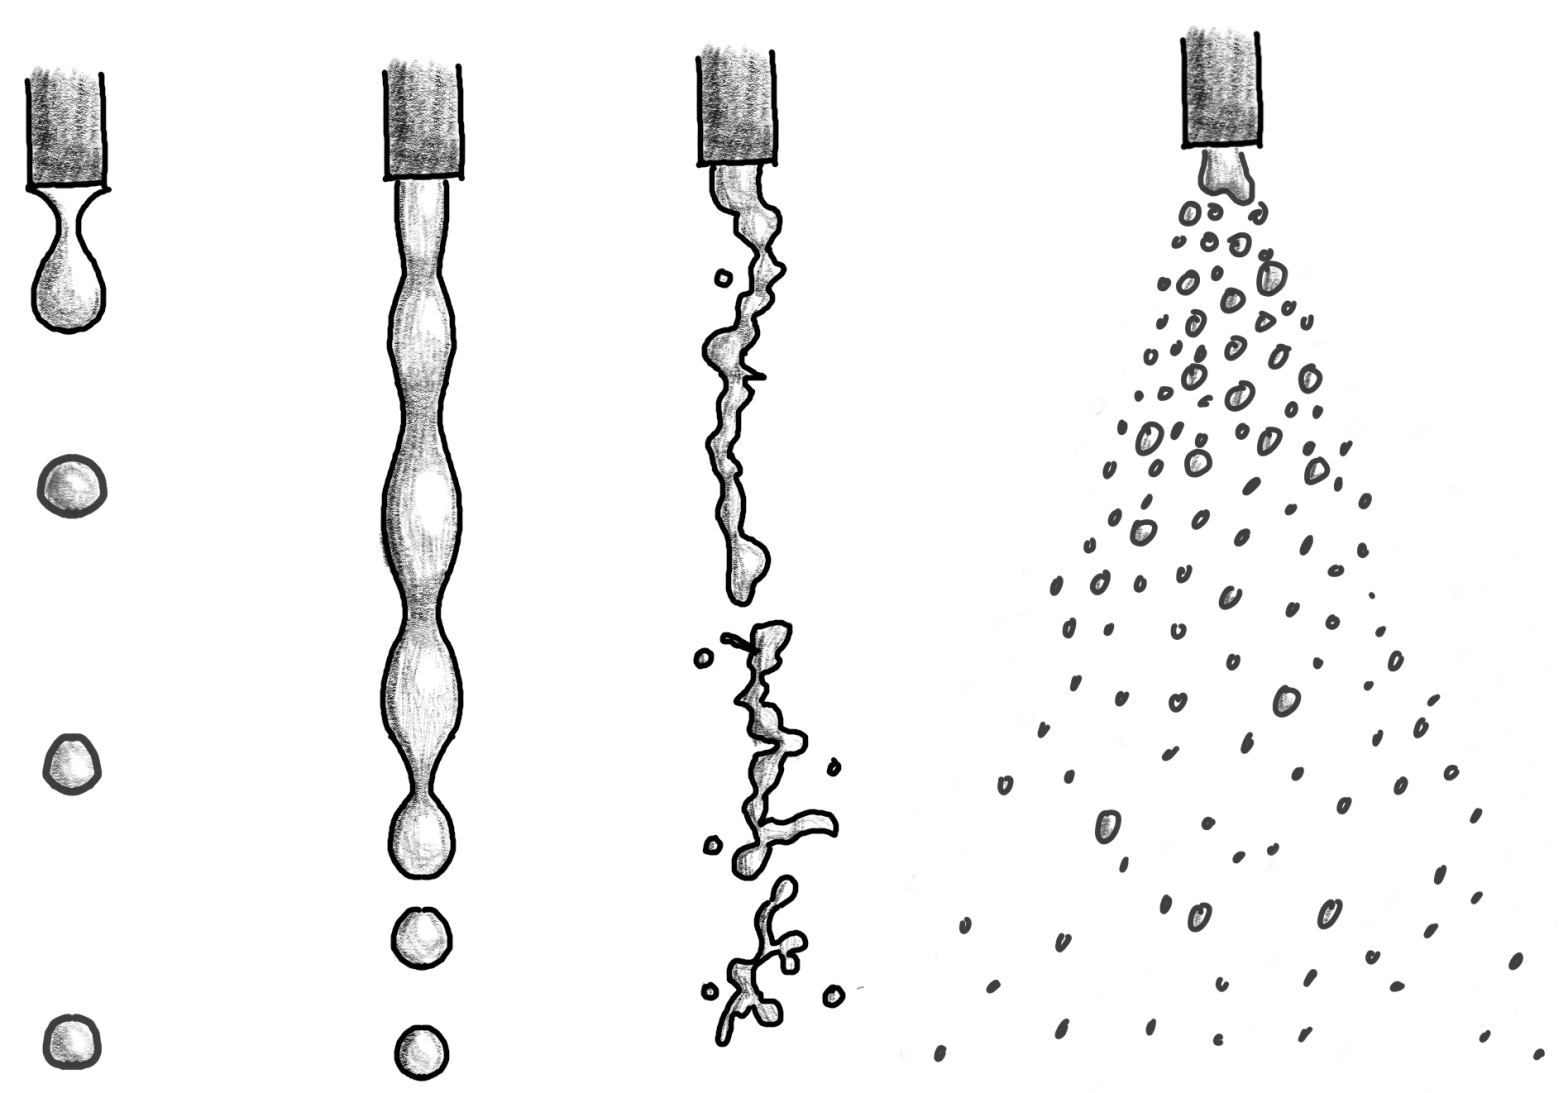
In this post, I discuss the physics of kettle stream and how we can maximize extraction evenness by changing pour rate and height.
